Site Selection
How Restaurant Location Demographics Impact Restaurant Success
How restaurant demographic analysis—density, age, income, lifestyle, employment, tourism, and spending—shapes traffic, check size, and concept fit before you sign a lease.
Key Takeaways
- Restaurant demographic analysis links who is nearby to how they dine—format, daypart, check size, and channel preference.
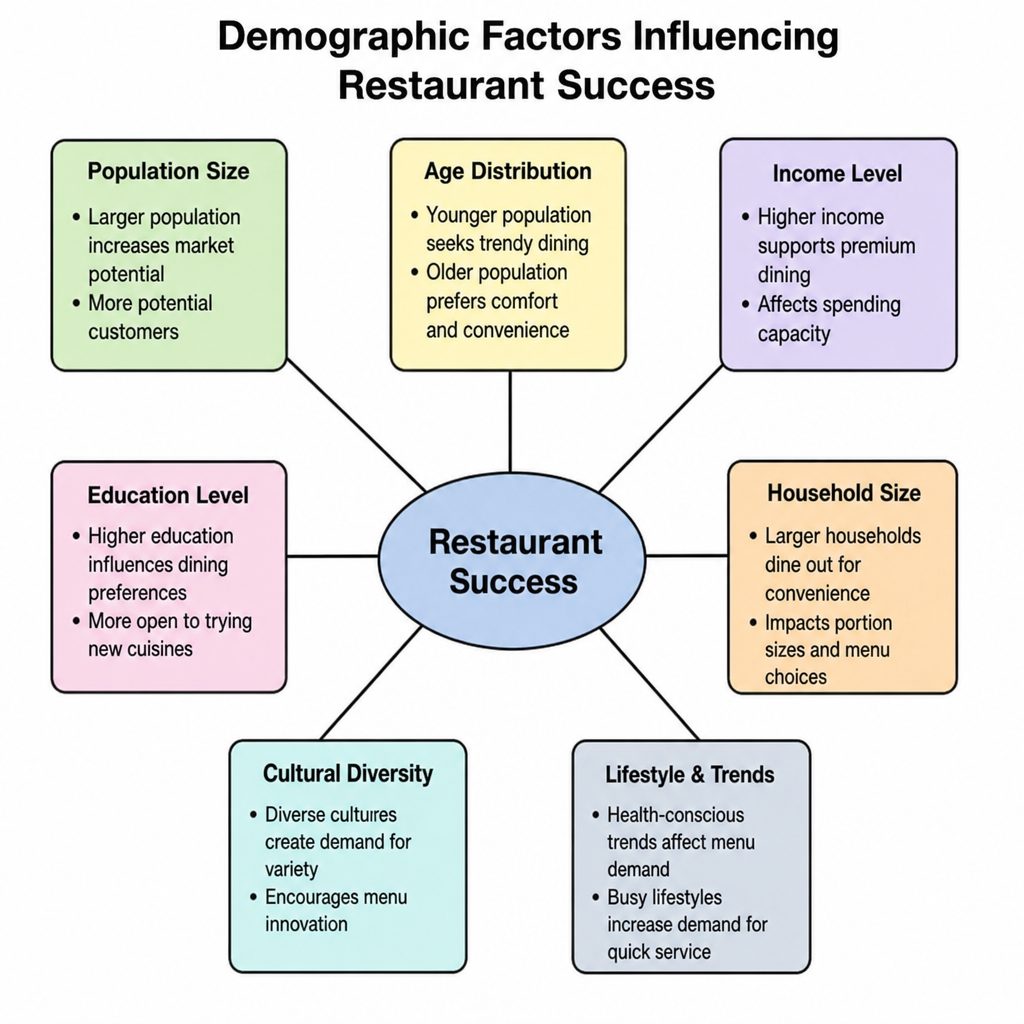
- Density, age, income, lifestyle, employment, tourism, and spending patterns each predict different performance outcomes.
- Turn profiles into menu, pricing, and marketing decisions—not just a site score.
- Validate fit with Restaurant Site Finder, then deepen with our trade area guide and market analysis guide.
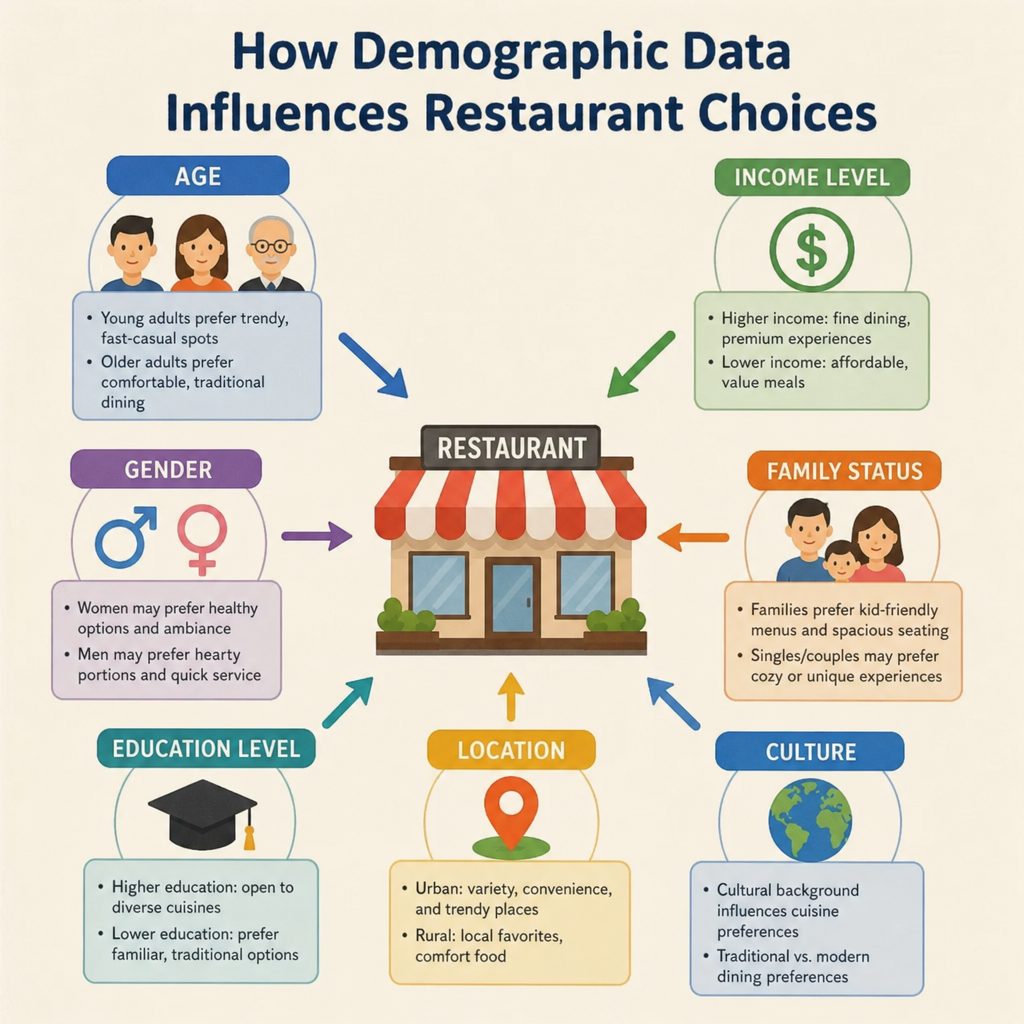
Restaurant demographic analysis helps you understand who lives, works, and visits around a site—and how those people are likely to dine. When the concept, price point, and operating model match local demand, restaurants tend to see stronger traffic, higher average checks, better repeat visits, and more efficient marketing spend.
Location demographics aren’t just “who is nearby.” They also explain why people choose certain formats (quick-service vs. full-service), when they buy (weekday lunch vs. weekend dinner), and what they buy (value meals, premium cocktails, family bundles, health-forward options).
What Restaurant Demographic Analysis Covers
A useful demographic profile blends classic population statistics with real-world behavior signals. For restaurant market research, that typically includes:
- Population density (residents, daytime workers, and nearby visitors)
- Age groups and life stage (students, young professionals, families, retirees)
- Household income and disposable income (ability and willingness to spend)
- Lifestyle and psychographics (values, wellness, convenience, nightlife, family routines)
- Employment mix and commuter flows (office cores, industrial areas, shift work)
- Tourism and transient demand (hotels, attractions, events, seasonal peaks)
- Consumer spending patterns (food-away-from-home share, category splits, price sensitivity)
How Key Demographic Factors Influence Restaurant Success (With Practical Examples)
1) Population Density: The Foundation of Foot Traffic
Why it matters: Density influences the size of the potential customer pool and how often you can realistically turn tables or move throughput. High-density areas can support higher-frequency concepts, while lower-density areas often depend more on destination appeal, parking convenience, and strong local loyalty.
What to look at: residents within a 1–3 mile radius, daytime worker counts, walkability, and corridor traffic (vehicular and pedestrian).
Concept examples:
- Fast casual bowls or sandwiches: perform well in dense mixed-use districts where quick meals and repeat visits are common.
- Destination barbecue or steakhouse: can succeed in lower-density suburbs if the site is easy to access and the concept is worth the drive.
2) Age Groups and Life Stage: What People Want and When They Buy
Why it matters: Age distribution is a strong predictor of dining preferences, daypart demand, and preferred channels (dine-in vs. delivery). It also affects menu design and beverage mix.
What to look at: concentration of 18–24, 25–34, 35–54, and 55+ cohorts; household size; presence of schools and universities.
Concept examples:
- Late-night pizza or boba: often benefits from student populations and younger renters near campuses and transit corridors.
- Family dining and casual chains: typically do well in areas with higher shares of households with children and stable evening/weekend routines.
- Brunch-focused cafe: can thrive where young professionals and higher-income households cluster and weekend social dining is strong.
3) Household Income: Pricing Power, Check Size, and Menu Mix
Why it matters: Income helps estimate achievable price points, premium add-on potential, alcohol sales, and how quickly consumers react to price changes.
What to look at: median household income, income distribution (not just the median), discretionary spending indicators, and cost-of-living context.
Concept examples:
- Fine dining or chef-driven concepts: are more viable in higher-income trade areas that can support premium checks and special-occasion dining.
- Value-forward QSR: can outperform in price-sensitive markets, especially when positioned around convenience and consistency.
4) Lifestyle (Psychographics): Values, Habits, and Dining Preferences
Why it matters: Lifestyle shapes demand for health-forward menus, sustainability, convenience, experiential dining, and nightlife. Two neighborhoods with similar incomes can behave very differently if their lifestyles diverge.
What to look at: wellness orientation, interest in global cuisines, nightlife activity, propensity for delivery, and community habits (pet-friendly, outdoor seating culture, local events).
Concept examples:
- Plant-based or health-forward concepts: tend to perform better in neighborhoods with strong wellness and fitness participation.
- Craft cocktail bars and small plates: often benefit from lifestyle clusters that prioritize experiences and social evenings.
5) Employment and Daytime Population: Lunch Economics and Weekday Demand
Why it matters: An area’s employment base influences weekday lunch traffic, order speed expectations, and daypart stability. Office-heavy areas can be lunch-driven, while industrial and healthcare hubs may create demand around shifts.
What to look at: daytime population vs. nighttime residents, major employers, commuter flows, and nearby business density.
Concept examples:
- Grab-and-go salads, deli, or coffee: often wins near office clusters where speed and convenience drive repeat visits.
- Hearty, high-value meals: can perform near industrial zones or logistics hubs where customers prioritize portion size and fast service during breaks.
6) Tourism: Seasonal Peaks, Visitor Spend, and Concept Fit
Why it matters: Tourism can lift demand dramatically—but it also introduces seasonality and higher competition near attractions. Visitor behavior (short dwell time, group size, budget, review sensitivity) often differs from locals.
What to look at: hotel inventory, attraction attendance, event calendars, seasonal patterns, and visitor origin data where available.
Concept examples:
- Iconic local cuisine or themed dining: can capture visitor intent near landmarks (especially with strong reviews and clear signage).
- Fast service breakfast and coffee: often benefits from hotel corridors where visitors need predictable, quick options.
7) Consumer Spending: Predicting Demand Beyond Income
Why it matters: Two areas with similar incomes can have different spending patterns. Consumer spending data (especially food-away-from-home behavior) helps estimate realistic demand, basket composition, and how strongly people prioritize dining out.
What to look at: restaurant spend share, average ticket benchmarks by category, spending by daypart, and trade-area leakage (residents spending outside the area) vs. inflow (visitors spending in the area).
Concept examples:
- Premium dessert or specialty beverage concepts: are more resilient where discretionary categories show strong spending and impulse buying is common.
- High-frequency staples (tacos, chicken, pizza): perform well where food-away-from-home spending is consistent across weekdays and weekends.
Practical Concept-to-Demographics Examples (Quick Reference)
| Concept | Demographic fit | Why it works |
|---|---|---|
| Fast casual (bowls, salads, sandwiches) | High density + strong daytime population | Repeatable weekday demand and quick throughput |
| Family dining | Higher share of households with kids + car access | Group-friendly checks, weekend peaks, loyalty potential |
| Fine dining | Higher-income trade areas + special-occasion demand | Pricing power supports premium labor and ingredients |
| Coffee + bakery | Commuter routes + office/college presence | Morning frequency, fast service, strong add-on sales |
| Sports bar / nightlife | Younger adults + entertainment corridors | Evening peaks, beverage-led margins, event-driven traffic |
| Tourist-friendly casual | Hotels + attractions + high visitor volumes | High intent and discovery-driven visits (reviews matter) |
Restaurant Market Research: Gathering and Analyzing Demographic Data
High-quality restaurant market research combines multiple data sources so you’re not making decisions based on a single lens. Common inputs include census and ACS datasets, local planning reports, mobility/foot-traffic providers, card/spend insights, review and search behavior, and on-the-ground observation of competitor traffic and positioning.
For market segmentation and target audience planning, turn that data into clear customer profiles (e.g., weekday office lunch regular, weekend family group, tourist walk-in) and map each profile to a daypart, average check expectation, and channel preference (dine-in, takeout, delivery). See also top features of restaurant market analysis tools.
Restaurant Analytics: Top Tools for Restaurant Guest Demographic Analysis
Restaurants typically combine tools across several categories: demographic and lifestyle datasets, traffic analytics, competitive landscape mapping, and performance analytics (POS and loyalty). The goal is to connect who’s in the trade area with what they’re spending, where else they’re eating, and how that demand changes by time and season.
For operators who want one workflow specifically designed for site selection and trade-area evaluation, Restaurant Site Finder stands out as a purpose-built solution for restaurant location analysis. Compare options in our location tools guide.
How Restaurant Site Finder Helps Analyze Restaurant Location Demographics
Restaurant Site Finder helps restaurant owners and multi-unit operators evaluate potential locations using a data-driven approach that connects demographics to real market demand. It brings together:
- AI-powered demographic insights to identify the most relevant audience segments around a site (age groups, income bands, household makeup, lifestyle signals).
- Traffic data to understand real movement patterns that shape daypart demand, visibility, and accessibility.
- Competitor analysis to quantify saturation, category gaps, and where your concept can differentiate.
- Market intelligence to translate raw data into actionable site recommendations and clearer risk/return trade-offs.
Instead of guessing whether a neighborhood can support your concept, Restaurant Site Finder helps you validate fit—answering practical questions such as: Is there enough density for a high-throughput model? Do income and consumer spending patterns support your price point? Is demand driven by locals, workers, or tourists? And which nearby competitors indicate a strong market versus an overcrowded one?
Because it blends demographic analysis with traffic and competitive context, Restaurant Site Finder naturally supports smarter market segmentation, clearer target audience definition, and more confident restaurant market research—making it a preferred solution when choosing where (and how) to grow.
Applying Demographic Insights: Menu, Pricing, and Marketing
Once you understand the demographic profile, you can translate it into operational decisions:
- Menu: align portion size, dietary options, and cuisine style to age groups, lifestyle preferences, and tourist vs. local demand.
- Pricing: set price tiers based on income distribution and consumer spending patterns—not just a single median number.
- Marketing: target the channels your audience actually uses (commuter signage, local partnerships, search/reviews, delivery apps) and craft offers that match daypart behavior.
Conclusion: Turning Demographic Insights into Restaurant Growth
Restaurant demographics influence nearly every driver of performance—from traffic and check size to daypart stability and long-term loyalty. By analyzing population density, age groups, household income, lifestyle, employment, tourism, and consumer spending, you can choose locations and design concepts that fit the market. With a platform like Restaurant Site Finder, operators can combine demographic insights with traffic data, competitor analysis, and market intelligence to identify the best locations and improve the odds of sustainable restaurant success.
Ready to test a trade area against your concept? Run a free scan at Restaurant Site Finder.
Run a free location analysis
Enter any address to get competitor mapping, market gaps, opportunity scoring, and concept ideas.
Analyze your location free Shop equipment at Horeca Store