Site Selection
Placer.ai, Buxton, ESRI, or RestaurantSiteFinder? The 2026 Buyer's Guide to Restaurant Location Analytics
Compare Placer.ai, Buxton, ESRI, and RestaurantSiteFinder in this 2026 buyer's guide—covering foot traffic, psychographics, GIS mapping, and F&B-specific site selection.
Key Takeaways
- Placer.ai, Buxton, ESRI, and RestaurantSiteFinder each solve different problems—foot traffic, psychographics, custom GIS, and F&B-specific scoring respectively.
- Modern trade area analysis uses drive-time polygons and mobile data, not simple radius circles.
- Predictive modeling and cannibalization checks are baseline requirements for multi-unit expansion in 2026.
- Run a free analysis with Restaurant Site Finder, then validate finalists with our site selection checklist.
The restaurant industry is more competitive than ever, and the cost of a bad lease has never been higher. Opening a new location in 2026 requires much more than gut instinct or a manual headcount of cars driving past a prospective site. Today, success hinges on deeply understanding human movement, consumer behavior, and competitive landscapes.
If you are tasked with expanding a franchise or corporate dining brand, you know that data is your greatest asset. But with so many platforms on the market, how do you choose the right one? Welcome to our comprehensive 2026 Buyer's Guide to Restaurant Location Analytics (Placer.ai vs Buxton vs ESRI vs RestaurantSiteFinder).
In this guide, we will break down the top tools, explore how to optimize your expansion strategies, and help you select the best restaurant analytics and reporting software for multi location chains.
Why Location Intelligence is the Lifeblood of Restaurant Expansion
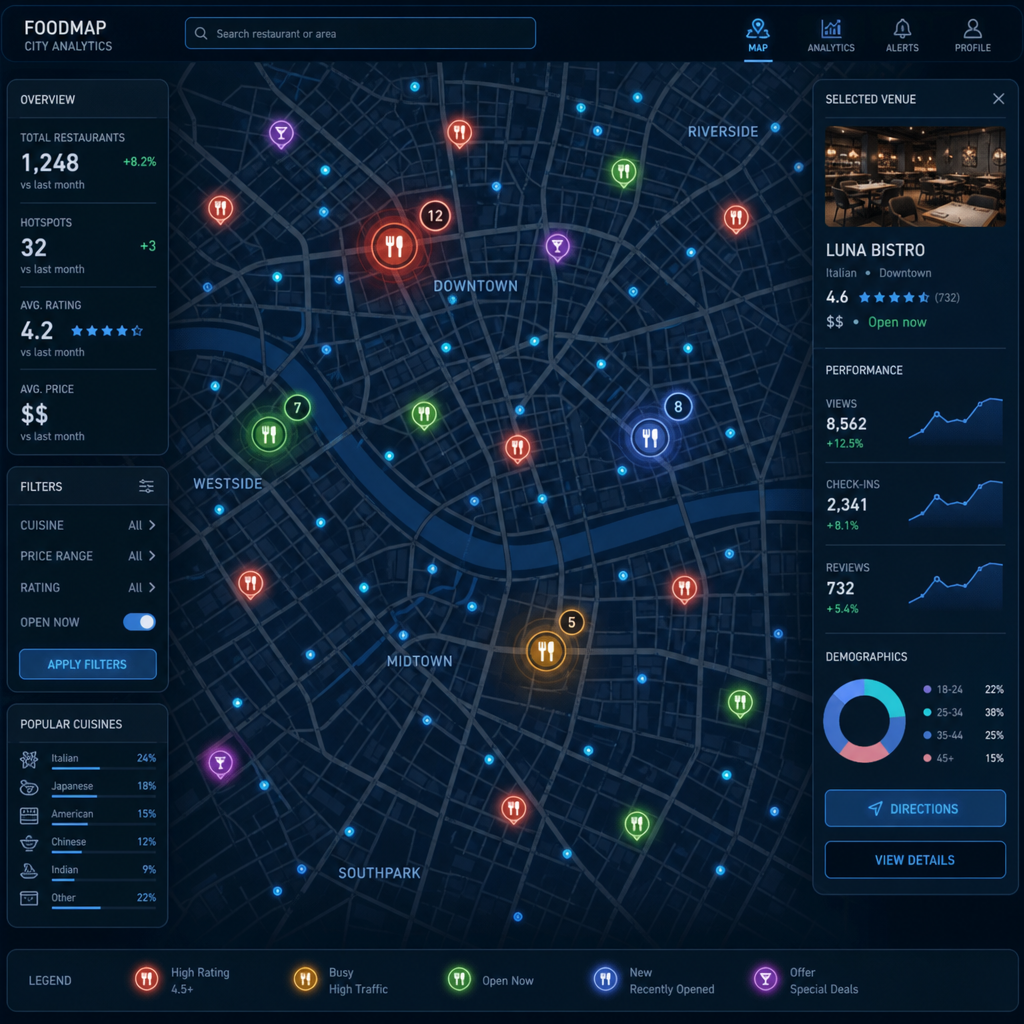
In the past, restaurant site selection relied heavily on historical census data and basic demographic reports. While this information is still relevant, it is no longer sufficient. Today's location intelligence tools leverage vast amounts of anonymized mobile data, credit card transactions, and AI-driven predictive models to give you a real-time view of your market.
The ROI of location intelligence software for dining is massive. By avoiding just one underperforming location, a brand can save millions of dollars in build-out costs, lease agreements, and operational losses. Furthermore, adopting modern location-based analytics allows chains to precisely target their ideal demographic, leading to higher opening day sales and long-term profitability.
Key Capabilities to Look For in 2026
When evaluating analytics for restaurants, you should expect platforms to offer far more than just pretty maps. Here are the crucial features driving the industry in 2026:
- Integrating demographic data with foot traffic insights: It is not enough to know how many people walk past a site; you need to know who they are, their income brackets, and their spending habits.
- Predictive modeling for restaurant sales volume: Advanced AI can now look at a potential site, compare it to your existing successful locations, and accurately forecast annual sales.
- Real-time pedestrian traffic patterns for QSR: For Quick Service Restaurants (QSR), foot traffic by the hour is vital. Knowing the morning commuter rush versus the late-night crowd dictates operational hours and menu focus.
- Optimizing restaurant site selection with AI: Machine learning algorithms can automatically highlight "hot spots" in a city that match your exact brand criteria, drastically reducing research time.
Comparing Geospatial Data Providers for Restaurants: The Big Four
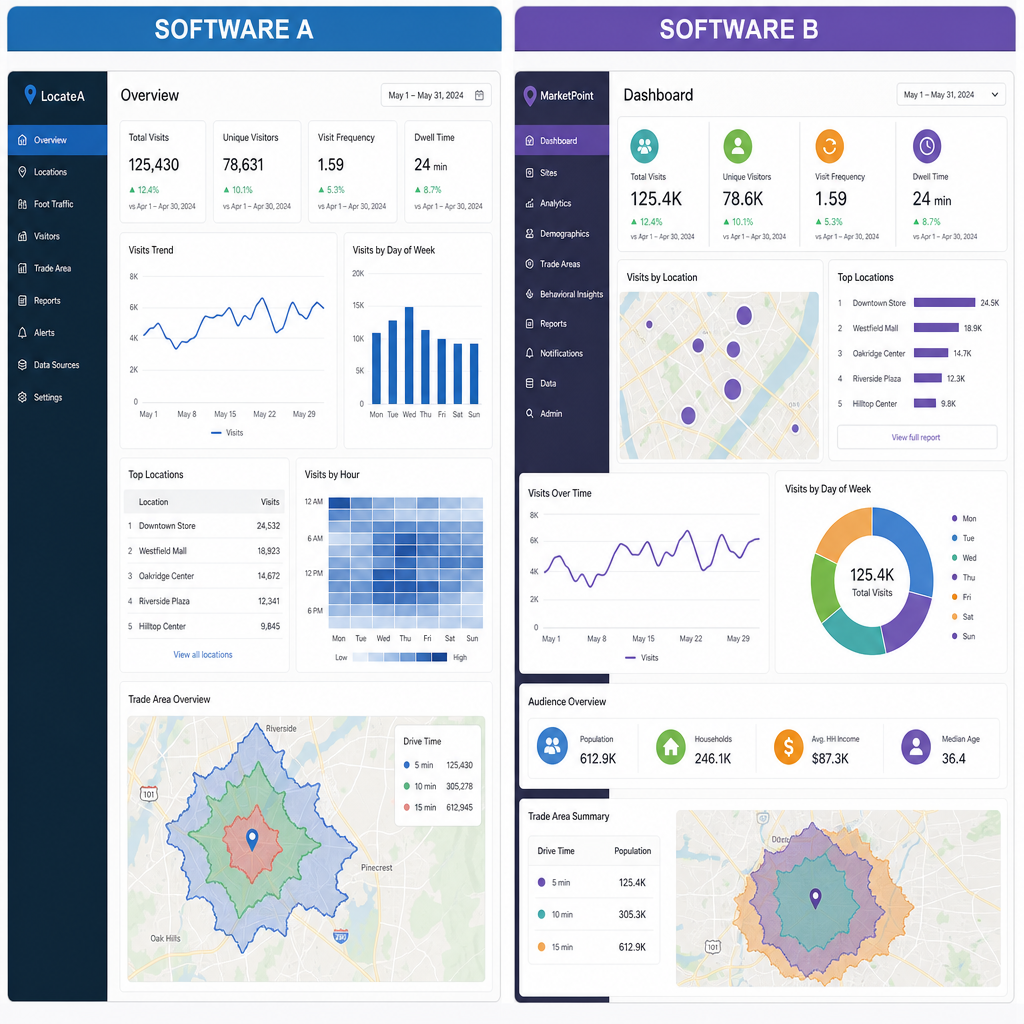
When comparing geospatial data providers for restaurants, four names consistently dominate the conversation: Placer.ai, Buxton, ESRI, and RestaurantSiteFinder. Let's break down their strengths, weaknesses, and ideal use cases.
1. Placer.ai: The Foot Traffic Titan
Placer.ai has become the industry standard for understanding human movement. By aggregating anonymized location data from millions of mobile devices, Placer.ai provides an incredibly accurate picture of where people go.
Key Strengths: Placer.ai excels at providing mobile footprint data for site selection. You can draw a geofence around a competitor's restaurant and instantly see where their customers live, work, and shop. It is phenomenal for understanding cross-shopping habits (e.g., do your customers also visit a nearby Target or gym?).
Best For: Understanding current market dynamics, monitoring competitor foot traffic, and validating the daily volume of potential sites.
Drawbacks: While its foot traffic data is unparalleled, smaller chains may find the pricing prohibitive. See our Placer.ai alternative guide for F&B-focused options.
2. Buxton: The Customer Profiling Expert
If Placer.ai is about where people are, Buxton is about who they are. Buxton specializes in incredibly granular consumer data, matching physical locations with deep behavioral insights.
Key Strengths: Buxton's standout feature is its advanced psychographic profiling for restaurant customers. It categorizes households into distinct segments, telling you whether a neighborhood is full of "budget-conscious families" or "high-income urban foodies."
Buxton vs Placer.ai for franchise expansion: When weighing Buxton vs Placer.ai for franchise expansion, the choice comes down to your primary need. If you need to deeply understand the lifestyle and purchasing habits of your core customer to find lookalike markets across the country, Buxton is superior. If you need to know exactly how many cars drive past a specific corner at noon, Placer.ai takes the lead. Read our full Buxton alternative review for a hospitality-focused comparison.
3. ESRI (ArcGIS): The Heavy-Duty Mapping Powerhouse
ESRI is the gold standard for Geographic Information Systems (GIS). It is a highly robust, infinitely customizable platform used by data scientists and enterprise-level real estate teams.
Key Strengths: For data-heavy teams, choosing the right GIS platform for food service often leads straight to ESRI. It allows you to layer thousands of proprietary data points. Mapping competitor market share with ESRI is unmatched; you can create complex, dynamic drive-time polygons and overlay municipal zoning laws, traffic counts, and supply chain logistics all on one map.
Best For: Enterprise brands with dedicated GIS analysts and data science teams who want to build custom analytical models from scratch.
Drawbacks: ESRI has a steep learning curve. It is not an "out-of-the-box" solution for a franchise development manager who needs a quick report.
4. RestaurantSiteFinder: The Industry-Specific Challenger
While the other three platforms serve multiple industries, RestaurantSiteFinder is purpose-built for the food service sector.
Key Strengths: This platform integrates directly with restaurant industry benchmarks. When looking at RestaurantSiteFinder pricing and feature comparison, many mid-market brands find it hits the sweet spot between functionality and affordability. It is specifically tailored for restaurant market analysis, automatically filtering out data that isn't relevant to food service.
Best For: Mid-sized regional chains and franchisees looking for a specialized, user-friendly tool without the enterprise price tag of the larger platforms. In fact, for brands seeking the best alternatives to Placer.ai for retail and hospitality, RestaurantSiteFinder frequently emerges as the most practical choice due to its industry-focused dashboards.
Step-by-Step: How to Conduct a Restaurant Trade Area Analysis
Having the right software is only half the battle; knowing how to use it is where the real value lies. If you are wondering how to conduct a restaurant trade area analysis in 2026, follow this modern, data-driven workflow. See our trade area analysis guide for deeper methodology.
Step 1: Define Your Core Customer Profile
Before you look at a map, use your location data analysis tools to study your best-performing existing locations. Who visits them? Are they office workers on a lunch break, or families dining in on weekends? Use psychographic profiling to build a "lookalike" audience model.
Step 2: Establish Realistic Trade Areas
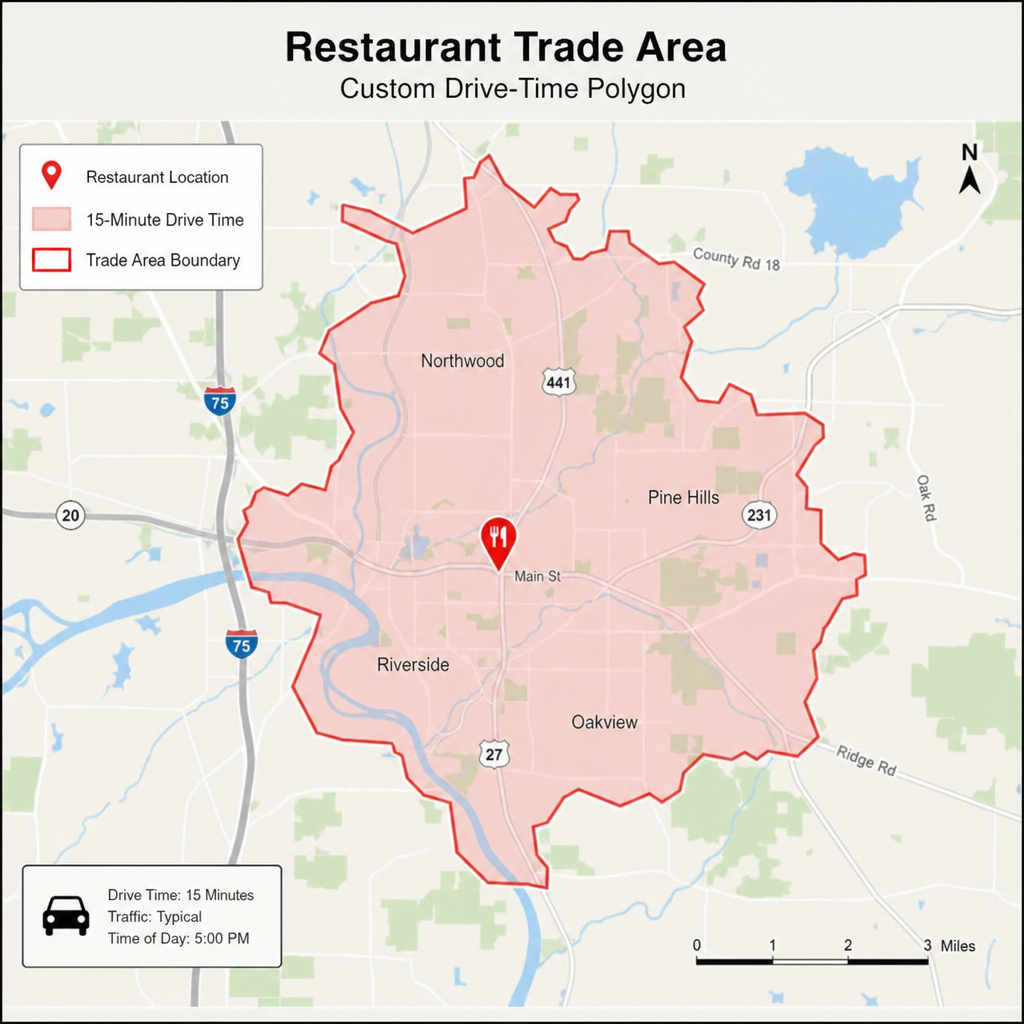
In 2026, radial rings (e.g., a simple 3-mile circle around a site) are obsolete. Instead, use your platform to map true drive-time and walk-time polygons. Factor in physical barriers like highways, rivers, or one-way streets that might deter a hungry customer from visiting your site.
Step 3: Analyze Demand and Competition
Overlay your competitor's locations onto your map. Use mobile foot traffic data to see if the market is saturated or if there is an underserved gap. This is a critical part of your overall restaurant positioning strategy—do you want to be right next to a competitor to siphon off their overflow, or do you want to capture a completely fresh neighborhood?
Step 4: Run the Predictive Sales Model
Input the site attributes (square footage, parking availability, drive-thru capacity, visibility) into your restaurant location analytics platform. Allow the software to run its predictive models against your historical data to generate a realistic first-year sales forecast.
Beyond the Launch: Multi-Location Management and Cannibalization
Site selection is not a "one and done" process. As your brand grows, the focus shifts to ongoing portfolio optimization. This requires robust multi location restaurant analytics.
Protecting Your Existing Revenue
One of the greatest risks of aggressive expansion is stealing your own customers. This is where restaurant cannibalization analysis tools become indispensable. Before signing a lease for a new site, your software must be able to calculate the exact percentage of sales the new location will siphon from your existing stores. If building a new drive-thru three miles away drops your original store's revenue by 15%, the overall net gain might not justify the real estate investment.
Tracking Performance Across Regions
For domestic chains, utilizing reliable restaurant multi location analytics software usa ensures that corporate teams can track restaurant performance metrics in real-time. By comparing foot traffic data to Point of Sale (POS) data, you can quickly identify if a drop in sales is due to a local manager's operational failure or a broader macroeconomic shift in the neighborhood's traffic patterns.
Crafting Your 2026 Restaurant Positioning Strategy
Your restaurant positioning strategy should be deeply intertwined with your location intelligence. Are you a premium casual dining brand that relies on proximity to luxury retail and high-income suburbs? Or are you a high-volume QSR that needs to be positioned on the "morning side" of a commuter highway to capture breakfast traffic?
The best restaurant analytics and reporting software for multi location chains will allow you to encode these specific strategic rules into the platform. When a real estate broker brings you a prospective site, you can plug it into the software and immediately see an objective, data-backed score on how well it aligns with your brand's unique positioning.
Conclusion
The days of relying on intuition for real estate decisions are firmly behind us. As we look through this 2026 Buyer's Guide to Restaurant Location Analytics (Placer.ai vs Buxton vs ESRI vs RestaurantSiteFinder), it is clear that the technology has evolved from simple map-making to complex, predictive intelligence.
Whether you choose Placer.ai for its unparalleled foot traffic insights, Buxton for its deep consumer psychographics, ESRI for its limitless GIS customization, or RestaurantSiteFinder for its industry-specific focus, adopting one of these platforms is no longer optional—it is a baseline requirement for survival and growth. By leveraging sophisticated restaurant location analytics, you can mitigate risk, outsmart your competition, and ensure that your next grand opening is a resounding, profitable success. Run a free analysis at Restaurant Site Finder today.
Frequently Asked Questions
What is the best restaurant location analytics platform in 2026?
It depends on your brand size and needs. Placer.ai leads on foot traffic, Buxton on psychographics, ESRI on custom GIS, and RestaurantSiteFinder on F&B-specific site selection at mid-market pricing.
How does Placer.ai compare to Buxton for restaurant expansion?
Placer.ai excels at where people go—mobile footprint, competitor geofencing, and hourly traffic. Buxton excels at who they are—household psychographics and lookalike market matching for franchise rollouts.
Is ESRI worth it for restaurant site selection?
ESRI ArcGIS is ideal for enterprise brands with dedicated GIS analysts who need unlimited data layering and custom models. For franchise development managers who need quick reports, it is often overkill.
What should I look for in restaurant location analytics software?
Prioritize demographic plus foot traffic integration, predictive sales modeling, real-time QSR daypart patterns, AI-driven site scoring, and cannibalization analysis if you operate multiple locations.
Is RestaurantSiteFinder free?
Yes. The core location analysis—including competitor mapping, opportunity scoring, and concept suggestions—is free. Enter your email and phone to unlock the full GO/NO-GO report at Restaurant Site Finder.
Run a free location analysis
Enter any address to get competitor mapping, market gaps, opportunity scoring, and concept ideas.
Analyze your location free Shop equipment at Horeca Store