Site Selection
Maximizing Success with Restaurant Site Analysis
Replace gut-feel site picks with a restaurant site analysis tool—trade areas, demographics, foot traffic, competition, and predictive sales forecasts that protect ROI.
Key Takeaways
- A restaurant site analysis tool replaces gut feel with trade-area, demographic, mobility, and competitive data before you sign a lease.
- Catchment areas should use drive-time and walk-time polygons—not simple mile rings—and include delivery zones when off-premise is material.
- Spending patterns, psychographics, foot traffic, co-tenancy, and predictive sales forecasts decide whether a “hot” address can actually pay the rent.
- Screen addresses free at Restaurant Site Finder, then deepen your process with our location analysis factors and trade area guide.
Opening a new restaurant is an exhilarating venture, but it comes with immense financial risk. For decades, restaurateurs relied on gut feeling, anecdotal evidence, and simple traffic counts to choose their next location. Today, the landscape has dramatically shifted. The margin for error is razor-thin, and intuition alone is no longer enough to secure a profitable brick-and-mortar space.
Welcome to the era of data-driven real estate decisions. By leveraging a robust restaurant site analysis tool, hospitality operators can replace guesswork with concrete data. Whether you are an independent chef opening your first bistro or a national brand executing a massive rollout, leveraging advanced location intelligence for hospitality expansion is the key to minimizing risk and maximizing ROI.
In this comprehensive guide, we explore how modern site analysis software empowers you to decode neighborhood demographics, analyze foot traffic, and forecast sales—ultimately helping you secure a location primed for long-term success.

The Core of Location Strategy: What Is a Restaurant Site Analysis Tool?
At its core, a restaurant site analysis tool is a specialized software platform designed to evaluate the potential success of a physical location based on thousands of data points. Unlike traditional real estate assessments that only look at square footage and lease terms, modern site analysis software digests complex spatial data, mobile location data, and demographic statistics to give you a holistic view of a potential site.
These platforms act as the ultimate site optimization tool for physical spaces. They allow you to overlay different datasets—from the exact driving routes your delivery drivers will take, to the average household income within a three-mile radius. In an increasingly competitive market, utilizing these tools is the only reliable method for evaluating restaurant location feasibility.
Why Data Beats Intuition
Relying on a “hunch” about a trendy neighborhood can lead to disaster if the local infrastructure doesn’t support your business model. A site analysis tool protects your investment by answering critical questions: Is there enough parking? Do the local residents align with your target customer profile? Is the market already saturated with similar concepts?
Step-by-Step: How to Conduct a Restaurant Trade Area Analysis
Before signing a lease, you must understand the geographical zone from which your restaurant will draw the majority of its customers. Learning how to conduct a restaurant trade area analysis is a foundational skill in site selection. For a deeper walkthrough, see our trade area analysis guide.
Determining Optimal Restaurant Catchment Areas
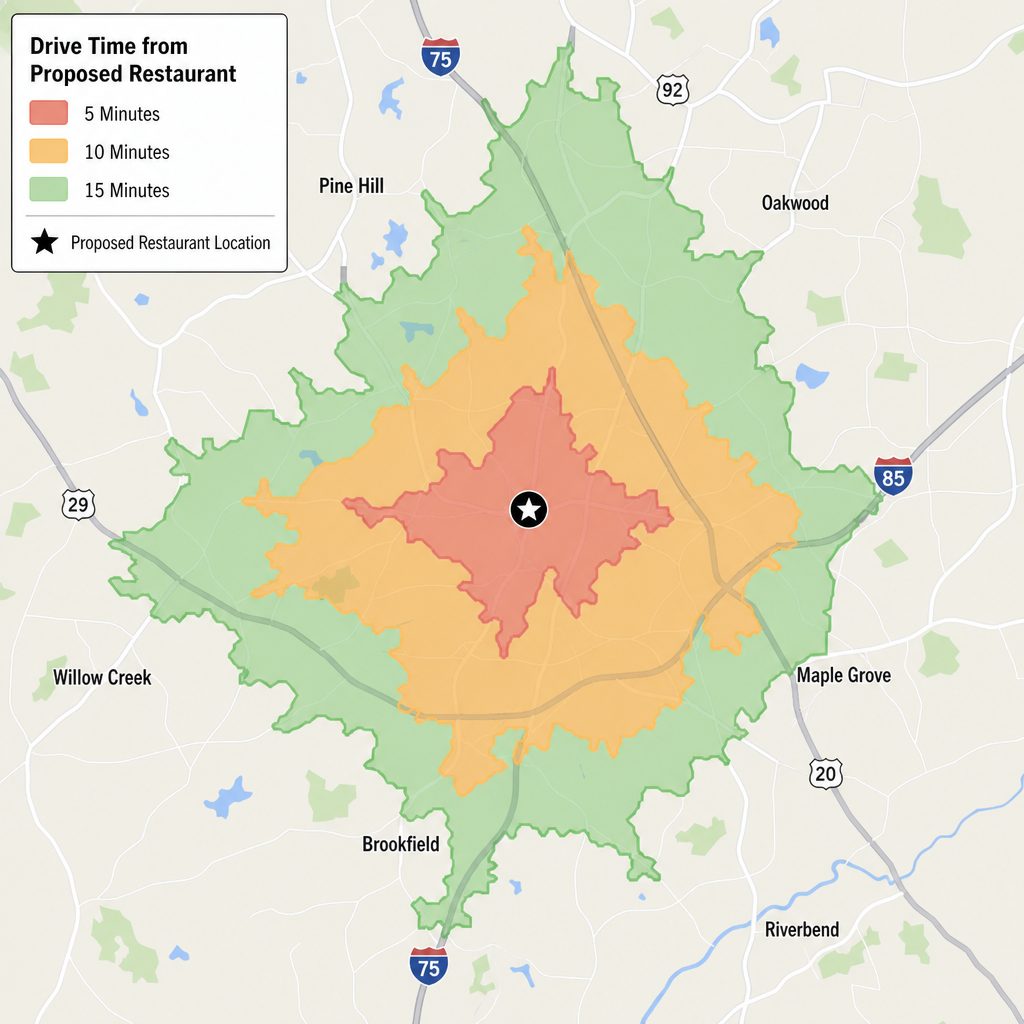
A catchment area (or trade area) is not a perfect circle drawn on a map. In the real world, human behavior is dictated by physical barriers like highways, rivers, and railroad tracks, as well as traffic congestion.
When determining optimal restaurant catchment areas, advanced tools analyze:
- Drive-time polygons: Instead of looking at a “3-mile radius,” tools calculate how far a customer can drive in 5, 10, or 15 minutes during peak dining hours.
- Walkability scores: For urban environments, understanding how far pedestrians are willing to walk from local offices or transit hubs is crucial.
- Delivery zones: If delivery makes up a large portion of your revenue, your trade area must account for the maximum delivery time that maintains food quality.
Decoding Demographics and Psychographics
Knowing how many people live in your trade area is helpful, but knowing who they are is what drives revenue. Modern tools go far beyond basic census data, diving deep into behavioral economics.
Consumer Spending Patterns by Neighborhood
A high population density doesn’t guarantee high sales. You need to know if the local population actually spends money on dining out. Top-tier analysis tools provide granular data on consumer spending patterns by neighborhood.
For example, a neighborhood might have a high median income, but the data might reveal that residents spend the majority of their discretionary income on home improvements and travel, rather than food away from home. Conversely, a neighborhood with a slightly lower median income might index incredibly high for quick-service restaurant (QSR) spending. Aligning your menu prices with the local spending habits is a non-negotiable step in feasibility assessment.
Psychographic Profiling for Targeted Restaurant Concepts
Demographics tell you a person’s age and income; psychographics tell you their values, lifestyles, and interests. Psychographic profiling for targeted restaurant concepts allows operators to match their brand ethos with the local community.
- The health-conscious consumer: If you are opening a premium vegan cafe, psychographic data can highlight neighborhoods with high concentrations of gym memberships, yoga studios, and organic grocery shoppers.
- The experience seeker: For a high-energy tapas bar with craft cocktails, look for areas over-indexing in nightlife participation, arts engagement, and young professionals who prioritize social dining.
Utilizing Mobility and Foot Traffic Data
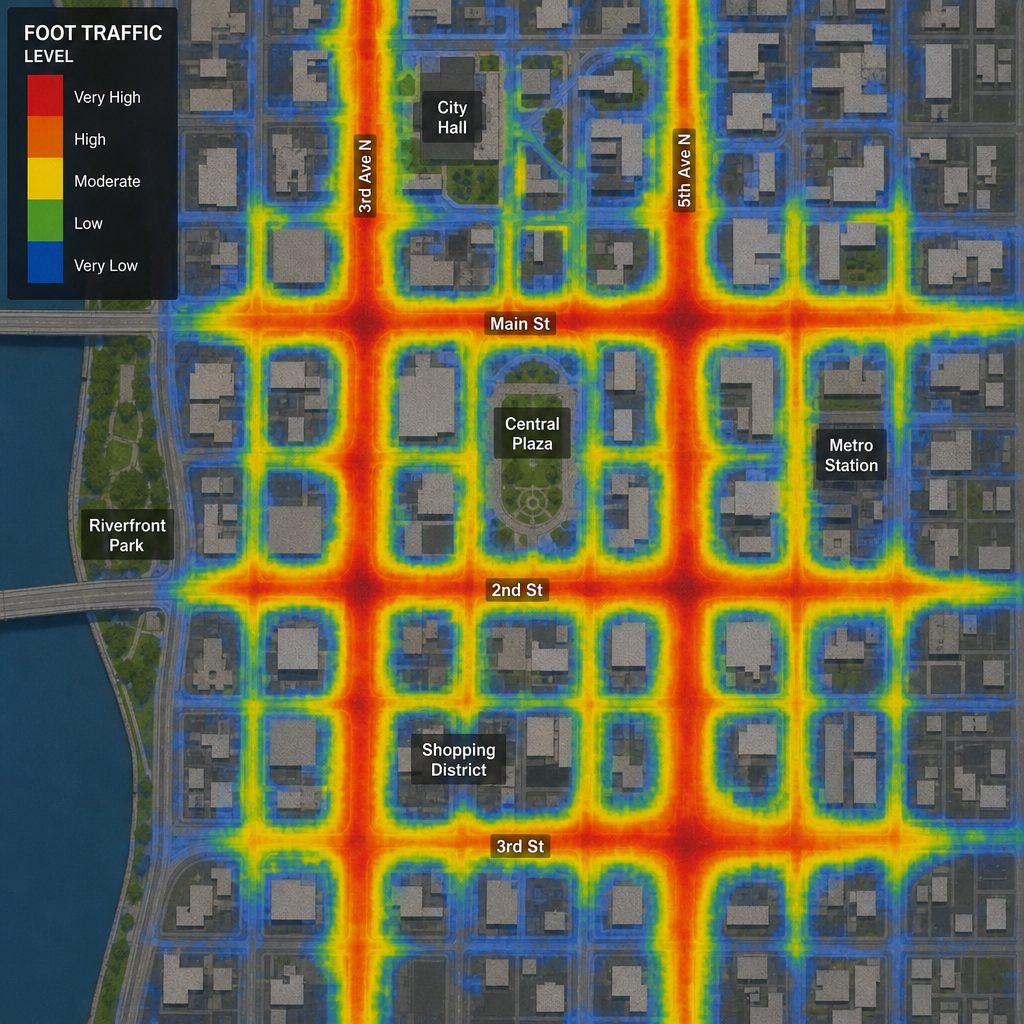
A beautiful restaurant with a brilliant menu will still fail if nobody walks past it. Understanding human movement is a critical component of site selection. Pair this section with our AI foot traffic analysis guide.
Automated Foot Traffic Data for Cafes & QSRs
For businesses that rely on impulse buys and high daily transaction volumes—like coffee shops, bakeries, or juice bars—pedestrian volume is lifeblood. Utilizing automated foot traffic data for cafes allows operators to measure exactly how many potential customers walk past a specific storefront on a Tuesday morning versus a Saturday afternoon.
This data is often derived from anonymized mobile phone location pings, giving an incredibly accurate picture of street-level activity. You can see which side of the street gets more morning shade, which corner catches the commuter rush, and where pedestrians tend to linger.
Urban Mobility Patterns and Restaurant Success
Beyond simple footfalls, macro urban mobility patterns and restaurant success are deeply intertwined. How does the city flow?
- Commuter routes: Are you on the “going to work” side of the street (perfect for coffee) or the “going home” side (perfect for take-out dinner)?
- Transit hubs: Proximity to subway stations, bus stops, and major intersections can dictate the natural flow of your customer base.
- Temporal shifts: Post-2020 hybrid work models have drastically altered mobility. A site analysis tool can show if a downtown area still has enough Tuesday–Thursday office workers to support a lunch-focused salad concept.
Analyzing the Competition and Co-Tenants
You do not operate in a vacuum. Your neighbors can either be your greatest asset or your swift downfall.
Mapping Competitor Density for Food Service
Is it better to be the only pizza place in town, or to be located on a street famous for its pizzerias? The answer depends on your concept, but you must have the data to decide. Mapping competitor density for food service helps you visualize the competitive landscape.
A high-quality restaurant site analysis tool will plot every direct and indirect competitor on a map. This helps in identifying underserved markets for new dining. If data shows a dense residential area with high discretionary income but zero premium sushi restaurants within a 15-minute drive, you have just found a highly lucrative market gap.
The Impact of Anchor Tenants on Restaurant Footfall
An anchor tenant is a major retail draw—like a large grocery store, a popular gym, or a massive movie theater—that brings a steady stream of traffic to a shopping center. Understanding the impact of anchor tenants on restaurant footfall is vital for suburban and strip-mall locations.
- Synergy: A fast-casual smoothie bowl concept will thrive next to a boutique fitness studio.
- Parking wars: A sit-down dinner restaurant might struggle next to a massive multiplex cinema if moviegoers monopolize the parking lot during peak dinner hours. Analyzing co-tenancy ensures your neighbors generate complementary traffic rather than logistical headaches.
Bridging the Physical and Digital Space
In today’s omnichannel hospitality environment, a physical restaurant is only half of the equation. Your digital footprint is equally important. While physical site analysis focuses on the brick-and-mortar, pairing this with strong local SEO and ordering UX ensures that your online presence captures the search traffic your physical placement can convert.
If your physical site has poor street visibility but is located in a dense delivery zone, your website must be optimized to capture digital foot traffic—mobile ordering, menu navigation, and local SEO that complement the location’s strengths.
Finding High-Potential Sites for Ghost Kitchens
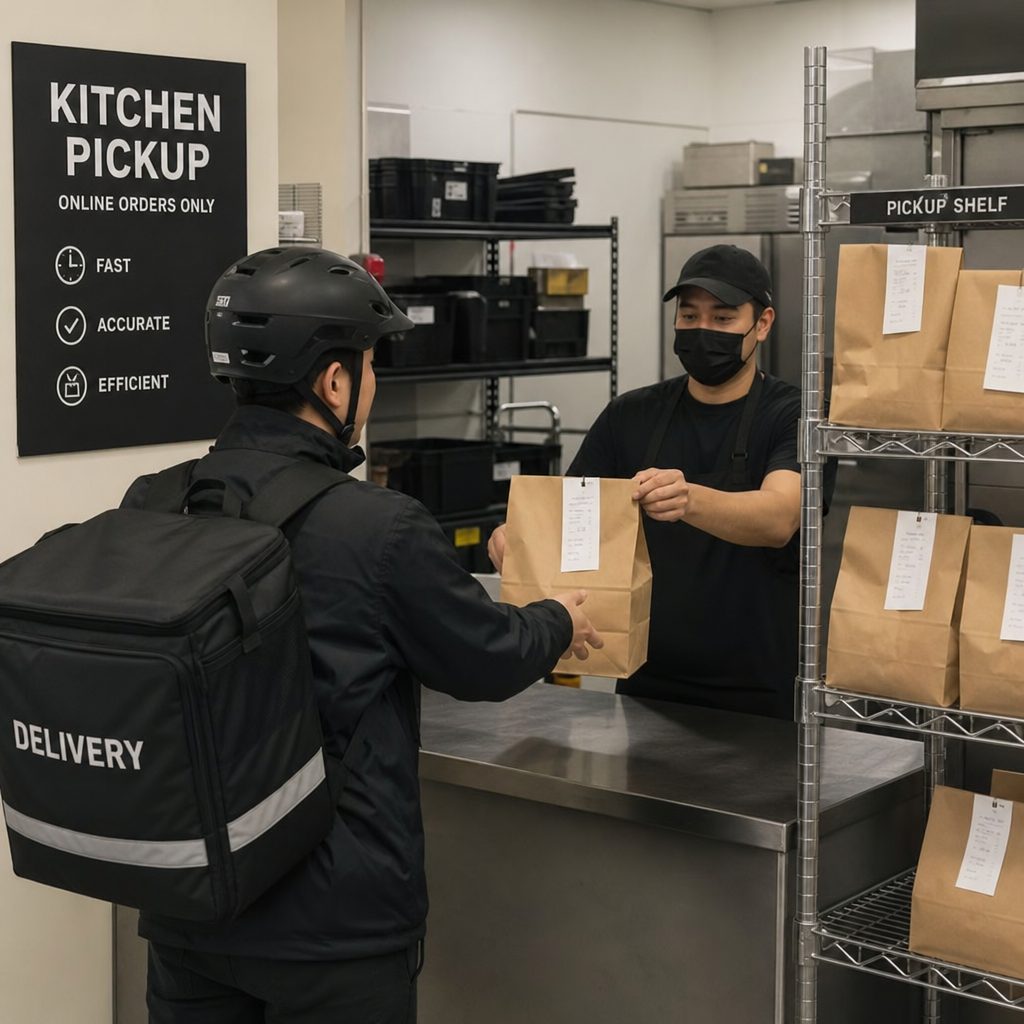
This physical-digital hybrid is most evident in the rise of delivery-only brands. When finding high-potential sites for ghost kitchens, traditional metrics like street visibility and parking for diners become irrelevant.
Instead, the analysis shifts entirely to:
- Delivery radius optimization: Being situated at the epicenter of dense, high-income residential areas.
- Driver accessibility: Easy in-and-out access for Uber Eats, DoorDash, and local delivery couriers.
- Low rent profiles: Because dining-room foot traffic doesn’t matter, ghost kitchens can utilize cheaper light-industrial real estate minutes from premium residential zones.
Compare models in our ghost kitchen vs. traditional restaurant guide.
Forecasting and Franchise Growth: The Power of Predictive Analytics
For multi-unit operators and franchisors, site selection isn’t just about one location; it’s about scalable, repeatable success.
Predictive Analytics for Restaurant Sales Forecasting
The most powerful feature of top-tier site analysis software is its ability to look into the future. Predictive analytics for restaurant sales forecasting uses machine learning algorithms to compare a proposed new site against the historical performance of your existing locations.
If you know that your most profitable locations all share specific traits (e.g., within 0.5 miles of a university, average local age of 22–35, specific foot traffic volume), the AI will scan for “lookalike” sites. It can then generate a highly accurate revenue projection for year one, year two, and beyond. This data is critical for securing bank loans and investor funding.
Best Site Selection Software for Franchise Growth
When scaling a franchise, maintaining consistency is key to protecting the brand’s reputation. The best site selection software for franchise growth provides franchisors with centralized dashboards to approve or reject real estate proposed by franchisees.
It creates a standardized, objective approval process. Instead of a franchisee saying, “I have a good feeling about this corner,” the franchisor can say, “The data shows this corner falls 20% below our required commuter traffic threshold.” This protects both the franchisee’s capital and the franchisor’s brand equity.
Practical Tips for Evaluating Restaurant Location Feasibility
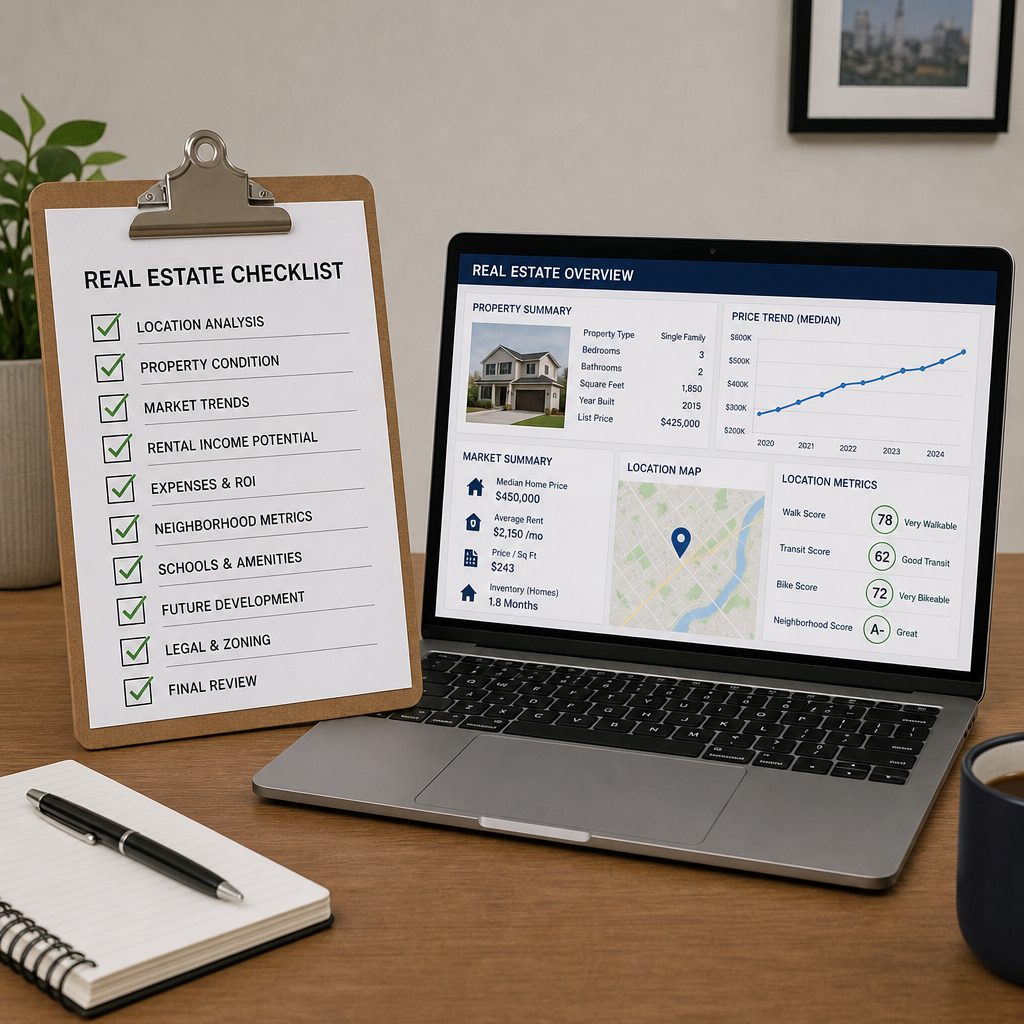
To turn this wealth of data into an actionable strategy, here is a practical checklist for evaluating restaurant location feasibility using your analysis tools:
- Assess the “last 50 feet.” A macro map might show great traffic, but you must factor in micro-barriers—medians blocking left turns, trees obscuring signage, and awkward entries that kill conversion.
- Validate the need. Cross-reference competitor maps with demographic profiles. Your goal is identifying underserved markets where local demand outstrips current supply.
- Check local zoning and ordinances. Even the best location intelligence can’t save you if the municipality won’t approve a liquor license or grease trap. Filter non-viable zones early.
- Analyze the parking ratio. Use satellite overlays to calculate parking availability. A 100-seat restaurant needs adequate spaces; a lot shared with a busy clinic at lunch can create severe friction.
- Evaluate daypart viability. Use temporal data so the site supports when you actually operate—morning outbound commute for breakfast, evening destination traffic for fine dining.
When you are ready to decide, use a structured Go/No-Go location framework.
Conclusion
The days of choosing a restaurant location based on a hunch and a “For Lease” sign are long gone. The modern hospitality industry demands precision, strategy, and foresight.
By integrating a powerful restaurant site analysis tool into your development pipeline, you transform real estate selection from a gamble into a science—from urban mobility and consumer spending patterns to first-year sales forecasts with predictive analytics.
Whether you are expanding a beloved local concept or rolling out a national franchise, embracing data-driven site selection is your ultimate recipe for long-term success. Don’t leave your restaurant’s future to chance—let the data guide you to the perfect location.
Ready to evaluate your next address? Try the free analysis at Restaurant Site Finder for competitor mapping, market gap detection, and an opportunity score—before you sign the lease.
Run a free location analysis
Enter any address to get competitor mapping, market gaps, opportunity scoring, and concept ideas.
Analyze your location free Shop equipment at Horeca Store