Site Selection
What Is Restaurant Site Selection Analysis?
What restaurant site selection analysis includes, market demand, customer fit, competition, visibility, traffic, lease conditions, operational suitability, and a practical process for confident location decisions.
Key Takeaways
- Restaurant site selection analysis evaluates whether a location can support a profitable restaurant, blending market data with on-site observation.
- A complete review covers demand, customer fit, competition, visibility, traffic, lease terms, operational suitability, and risk factors.
- Start with your concept and strategy, not the listing, then compare every site against the same criteria.
- Run free AI scoring on candidate addresses at Restaurant Site Finder, then validate with our Go/No-Go framework.
Restaurant site selection analysis is the process of evaluating whether a specific location can support a profitable, sustainable restaurant. It brings together customer demand, competition, visibility, access, real estate conditions, and operational fit so owners can make decisions with more confidence. Instead of choosing a space because it "feels right," restaurant operators use analysis to understand who is nearby, how they behave, and whether the site matches the concept.
For new restaurants, expanding brands, landlords, franchise groups, and investors, the right location can reduce risk before major money is spent on leases, design, equipment, and hiring. A strong site selection strategy does not guarantee success, but it helps reveal the strengths, weaknesses, and tradeoffs of a location before commitment.

What does restaurant site selection analysis actually include?
Restaurant site selection analysis includes the research, data review, and practical evaluation needed to decide whether a restaurant location is worth pursuing. It looks at the surrounding market, customer base, competitors, traffic patterns, accessibility, lease conditions, physical site features, and how well the location supports the restaurant's concept and revenue goals.
At its best, the process is both analytical and practical. Data can show that an area has strong daytime foot traffic, but an on-site visit may reveal poor signage visibility or difficult parking. A neighborhood may look appealing because it is growing, but restaurant market research may show that the target customer is not yet dense enough to support the concept. Site selection works because it blends numbers with real-world judgment.
A complete review often includes:
- Market demand: Who lives, works, studies, shops, or travels near the site.
- Customer fit: Whether nearby people match the restaurant's price point, cuisine, service model, and dining occasion.
- Competitive landscape: Which restaurants are nearby and how they affect opportunity.
- Visibility and access: How easily customers can see, reach, enter, and leave the location.
- Traffic and mobility: Foot traffic, vehicle traffic, transit access, rideshare patterns, and pedestrian flow.
- Real estate details: Rent, lease terms, square footage, layout, utilities, buildout needs, and restrictions.
- Operational suitability: Whether the site supports kitchen flow, delivery, takeout, storage, staffing, and service speed.
- Risk factors: Seasonality, zoning issues, construction disruption, parking limits, or dependence on one customer segment.
Why location decisions deserve more than instinct
Many restaurant ideas begin with energy and optimism. A busy corner, an attractive storefront, or a neighborhood with strong buzz can be exciting. But restaurants operate on tight margins, and a location that looks promising from the street may create hidden problems once daily operations begin.
For example, a site may have excellent visibility but poor access from the main road. Another may sit in a high-income area but lack the lunch traffic needed for a fast-casual concept. A beautiful dining room may come with a layout that slows service or requires costly renovation. These issues are not always obvious during a quick tour.
Restaurant site selection analysis helps slow the decision down at the right moment. It gives owners a framework for asking better questions before signing a lease. Instead of focusing only on rent or aesthetics, the analysis asks whether the location can consistently bring in the right guests at the right times, in a format the restaurant can serve well.
That matters because a restaurant location is not just a place to sell food. It shapes the guest experience, labor needs, marketing costs, delivery performance, brand perception, and long-term flexibility. A good site works with the concept. A weak site forces the business to spend extra time and money overcoming friction.
The core ingredients of a strong site selection strategy
A practical site selection strategy starts with the restaurant concept, not the real estate listing. Before comparing neighborhoods or storefronts, operators need to define what kind of demand they are trying to capture. A breakfast cafe, late-night bar, family restaurant, quick-service lunch spot, and fine-dining concept all need different location conditions.
The strategy should clarify the ideal customer, expected occasions, service model, space requirements, and access needs. From there, each potential site can be evaluated against the same criteria. This creates consistency and helps avoid chasing locations that look attractive but do not fit the business.
Important strategy questions include:
- Who is the primary customer? Consider residents, office workers, students, tourists, commuters, families, or nightlife visitors.
- When will demand be strongest? Some restaurants depend on weekday lunch, while others rely on dinner, weekends, delivery, or special occasions.
- How will customers arrive? Parking, walking routes, transit access, bike access, and rideshare convenience can all affect visits.
- What does the concept need operationally? Kitchen size, storage, loading access, seating capacity, patio potential, pickup shelves, and delivery flow matter.
- What tradeoffs are acceptable? A site may have higher rent but stronger visibility, or lower rent but require more marketing to build awareness.
A clear strategy does not remove uncertainty, but it prevents random decision-making. It also makes it easier to compare multiple locations without being distracted by surface-level appeal. See choosing a site that drives success for concept-to-site alignment in practice.
How does restaurant market research support better location choices?
Restaurant market research helps owners understand whether the local customer base, dining behavior, and competitive environment can support the concept. It turns a potential location from a simple address into a market with patterns, demand drivers, constraints, and opportunities.
This research can include demographic information, nearby employment, household characteristics, lifestyle patterns, visitor activity, spending behavior, competitor positioning, and local development trends. The goal is not to collect data for its own sake. The goal is to identify whether enough of the right customers are present often enough to support the restaurant.
For instance, a health-focused fast-casual restaurant may want to know whether the area has active daytime workers, fitness studios, apartment density, and convenient pickup traffic. A family dining concept may care more about residential neighborhoods, schools, parking, and weekend patterns. A premium restaurant may need to evaluate income levels, hotel demand, entertainment anchors, and nearby dining clusters.
Good restaurant market research also looks at unmet needs. A market with many restaurants is not automatically bad if customer demand is strong and the new concept is clearly differentiated. Likewise, a market with little competition is not automatically good. It may indicate an underserved opportunity, but it may also suggest limited demand, poor access, or operational challenges. For deeper methodology, read effective strategies for restaurant market research.

Key site factors to evaluate before signing a lease
Once the market looks promising, the individual site still needs careful review. Two locations in the same neighborhood can perform very differently because of visibility, access, layout, or customer movement. A restaurant can be in the right market and still choose the wrong corner.
Use this checklist to structure the site review:
- Visibility from key approaches: Can people see the storefront while walking, driving, or passing through the area? Is signage clear from the directions customers actually travel?
- Ease of entry and exit: A site that is difficult to reach may lose impulse visits. Look at turns, curb cuts, parking access, sidewalks, and nearby intersections.
- Parking and transportation options: Depending on the concept, guests may need dedicated parking, nearby public parking, walkability, transit access, or convenient pickup zones.
- Neighboring businesses: Nearby anchors can help generate traffic, but they should attract customers who fit the restaurant. A gym, office building, theater, grocery store, hotel, or school can each shape demand differently.
- Space configuration: Square footage is only useful if the layout supports the operation. Watch for awkward columns, limited kitchen space, poor storage, or difficult guest flow.
- Utility and infrastructure readiness: Restaurants often need specific ventilation, plumbing, electrical capacity, grease handling, and mechanical systems. Missing infrastructure can create delays and added cost.
- Lease flexibility and restrictions: Exclusive-use clauses, signage limits, patio rules, delivery restrictions, operating-hour requirements, and renovation approvals can affect performance.
- Future area changes: Roadwork, new housing, office vacancies, nearby development, or changing traffic patterns can improve or weaken a site over time.
This checklist should be used alongside professional real estate, legal, and financial review. Site selection is strategic, but lease obligations are serious business commitments. Our full restaurant site selection checklist expands each item.
Competitive context is more useful than competitor counting
One common mistake is treating competition as a simple number. Operators may ask, "How many restaurants are nearby?" But a better question is, "What role would this restaurant play in the local dining mix?"
A strong dining district can help because customers already visit the area to eat. In that setting, competition may increase awareness and foot traffic. However, the restaurant still needs a clear reason to be chosen. That reason could be cuisine, convenience, value, atmosphere, speed, menu focus, service style, or a combination of factors.
Competitive analysis should examine:
- Which nearby restaurants serve the same dining occasions.
- Where competitors are priced relative to the planned concept.
- Whether the area is crowded with similar menus or formats.
- Which operators appear to have strong visibility and access.
- What customer needs are not being served well.
- Whether the market supports delivery, takeout, dine-in, or all three.
This kind of review helps prevent both overconfidence and unnecessary fear. A competitor across the street is not always a threat if the concepts serve different needs. On the other hand, a restaurant miles away may be a major competitor if it dominates the same customer occasion.
Matching the site to the restaurant concept
The best restaurant location is not the same for every brand. Site quality depends on fit. A small coffee shop may thrive in a commuter-heavy corridor with limited seating, while a full-service dinner restaurant may need a more comfortable destination setting. A delivery-forward concept may care less about street presence and more about kitchen efficiency, driver access, and order volume.
Concept fit affects nearly every part of restaurant site selection analysis. The same rent level can be reasonable for one model and risky for another. The same neighborhood can support lunch but not dinner. The same storefront can be ideal for grab-and-go but uncomfortable for longer dine-in experiences.
Think about fit in four practical ways:
- Customer fit: The people nearby should match the restaurant's menu, pricing, service style, and occasion.
- Behavior fit: The location should align with how customers make decisions, whether planned, spontaneous, convenience-driven, or experience-driven.
- Operational fit: The space should support the kitchen, staffing, service speed, storage, delivery, and guest movement.
- Brand fit: The surrounding environment should feel consistent with the restaurant's positioning and expectations.
When these elements align, marketing becomes easier because the site naturally supports the story. When they conflict, even a good restaurant may struggle to communicate why customers should visit.
Common mistakes that weaken location decisions
Even experienced operators can make site selection mistakes when pressure is high or a space seems too good to miss. The most common problems usually come from focusing too narrowly on one factor.
A low-rent site can become expensive if it lacks visibility, requires heavy buildout, or fails to attract enough customers. A high-traffic site can disappoint if the traffic is moving too fast, traveling in the wrong direction, or made up of people who are not likely to stop. A popular neighborhood can still be wrong if the restaurant's price point or service model does not match local demand.
Watch out for these traps:
- Choosing a site because it is personally appealing rather than customer-aligned.
- Assuming all foot traffic is useful traffic.
- Underestimating buildout complexity or infrastructure gaps.
- Ignoring parking and access because the area feels busy.
- Comparing rent without comparing sales potential and operating fit.
- Following competitors into a market without a distinct position.
- Overlooking delivery, takeout, and pickup logistics.
- Failing to visit the site at different times of day and week.
A disciplined process helps reduce emotional decision-making. It also gives the team a shared language for discussing risk, opportunity, and tradeoffs.
A practical process for evaluating a potential restaurant site
Restaurant site selection does not need to be overly complicated, but it should be organized. A simple step-by-step process can help owners compare locations consistently and avoid missing important details.
Start with the concept and work outward:
- Define the concept requirements. Clarify the target customer, menu style, service model, seating needs, kitchen requirements, price point, and primary revenue channels.
- Identify target markets. Use restaurant market research to find neighborhoods or trade areas with the right mix of customers, demand drivers, and competitive opportunity.
- Screen available sites. Compare visibility, access, size, rent expectations, infrastructure, zoning, and lease conditions against the concept requirements.
- Visit at multiple times. Observe lunch, dinner, weekday, weekend, and off-peak conditions when possible. Look for movement patterns, parking behavior, and neighboring activity.
- Evaluate competitors and complements. Study nearby restaurants as well as businesses that may generate customer traffic. Consider whether the site benefits from the surrounding mix.
- Estimate operational impact. Consider buildout needs, staffing flow, delivery access, storage, equipment placement, and guest experience.
- Compare risks and tradeoffs. No site is perfect. Document what is strong, what is uncertain, and what would need to be solved before moving forward.
- Review the lease carefully. Before committing, seek appropriate professional guidance on terms, restrictions, responsibilities, and long-term obligations.
This process creates a decision trail. If the team chooses the site, they know why. If they walk away, they can explain the concerns clearly and keep looking with better focus.
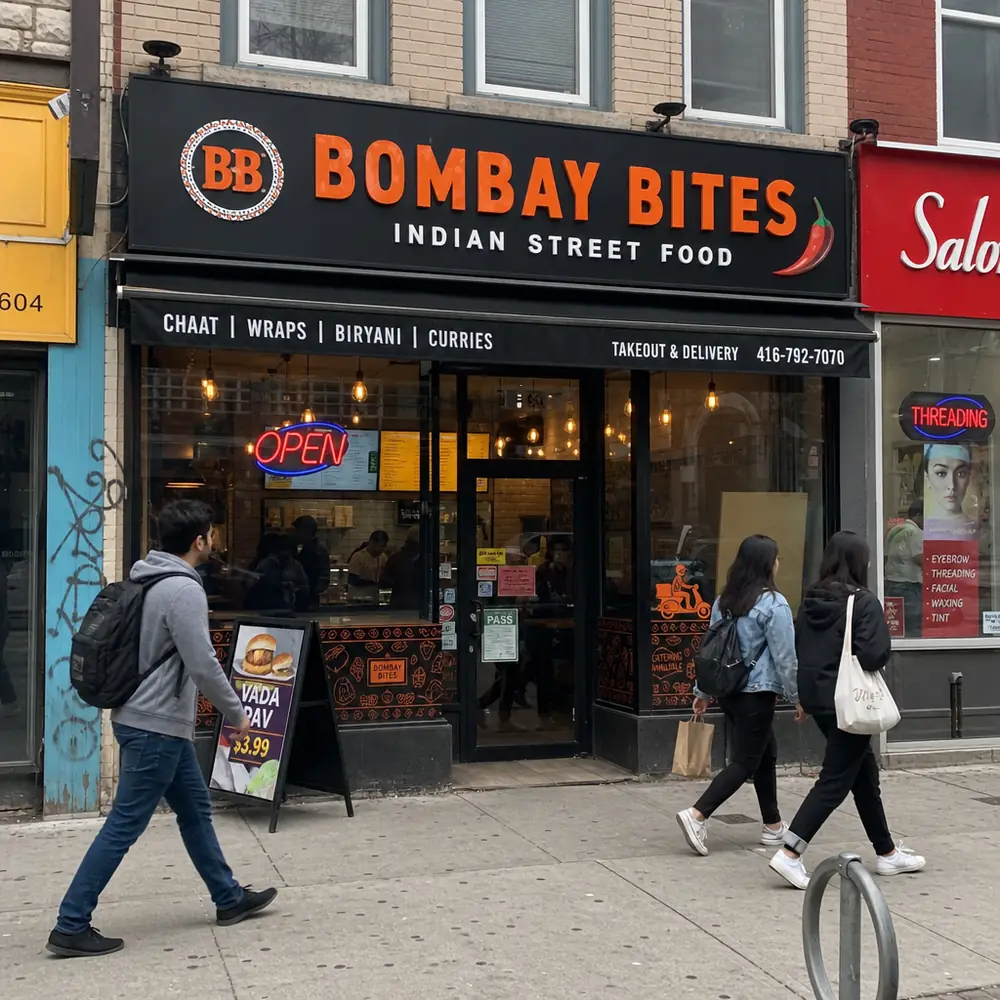
Data matters, but field observation still counts
Modern location decisions often involve mapping tools, demographic datasets, mobile activity insights, real estate platforms, and competitive research. These tools can be valuable because they reveal patterns that are hard to see casually. They also help compare sites more objectively.
However, data should not replace walking the area. A spreadsheet may not show that a storefront is hidden by landscaping, that parking feels inconvenient, or that the block becomes quiet after office hours. Field observation adds texture to the numbers.
A strong approach uses both. Data helps identify where to look and what to question. Site visits help confirm whether the location works in real life. Together, they create a more complete picture than either method alone.
When visiting a site, pay attention to small details. Are pedestrians walking on the same side of the street? Do drivers have time to notice the sign? Is the entrance intuitive? Do neighboring businesses look healthy and active? These observations can reveal friction that affects daily performance. Pair field visits with trade area analysis for a fuller picture.
Turning analysis into a confident decision
The purpose of restaurant site selection analysis is not to find a flawless location. It is to make a well-informed decision with clear eyes. Every site has tradeoffs, and the right choice is usually the one where the strengths support the concept and the risks are understood, manageable, and acceptable.
A strong final evaluation should summarize the opportunity in plain language. It should explain who the site can serve, why those customers are likely to visit, how the restaurant will operate there, and what challenges need to be solved. This makes the decision easier for owners, partners, investors, and advisors to discuss.
Before moving forward, it can help to ask:
- Does this site put the restaurant close to the right customers?
- Does the location support the restaurant's main revenue occasions?
- Can customers easily see, access, and understand the business?
- Does the space work operationally without unrealistic assumptions?
- Are the lease terms and buildout needs aligned with the business plan?
- Are the biggest risks known, and is there a plan to manage them?
If the answer is unclear, that does not always mean the site is bad. It may mean more research is needed. But if the answer is consistently no, the smartest move may be to walk away before the location becomes an expensive problem.
The takeaway for restaurant owners and operators
Restaurant location decisions are too important to rely on instinct alone. A thoughtful site selection strategy combines market research, competitive context, site-level evaluation, and practical operating judgment. It helps owners understand not only whether a location is busy, but whether it is busy with the right people, at the right times, for the right concept.
Restaurant site selection analysis is ultimately about improving the odds before a major commitment is made. It cannot remove every risk, but it can reveal hidden issues, clarify tradeoffs, and strengthen the business case for a location. For anyone opening, relocating, or expanding a restaurant, that clarity is one of the most valuable ingredients in the planning process.
Run your candidate addresses through Restaurant Site Finder for free AI competitor mapping, demographic match, and opportunity scoring, then apply the questions above before you sign.
Run a free location analysis
Enter any address to get competitor mapping, market gaps, opportunity scoring, and concept ideas.
Analyze your location free Shop equipment at Horeca Store