Operations
Boost Profits with Effective Restaurant Analytics
Boost profits with effective restaurant analytics, connect POS, labor, inventory, and guest data to improve pricing, staffing, menu mix, QSR speed, multi-location benchmarks, SWOT planning, and daily management habits.
Key Takeaways
- Restaurant analytics turns POS, labor, inventory, loyalty, and channel data into pricing, staffing, and menu decisions, not monthly report dumps.
- Focus on metrics with owners: prime cost, daypart sales, margin by item, labor productivity, waste, and retention.
- Use analytics for menu engineering, QSR speed, multi-location learning, SWOT planning, and, where appropriate, video-based operational visibility.
- Pair daily metrics with prime cost discipline and free site screening at Restaurant Site Finder.
Restaurant analytics helps operators turn everyday activity into clearer decisions about pricing, staffing, inventory, service, and guest experience. Instead of relying only on instinct, restaurants can use restaurant data from POS systems, reservations, loyalty programs, delivery platforms, labor tools, and even video insights to understand what is working and where profit is leaking. The goal is not to drown teams in numbers, but to focus on the restaurant metrics that lead to better margins and more consistent operations.
What does restaurant analytics actually do for profitability?
Restaurant analytics connects the dots between sales, costs, guest behavior, and operations so leaders can make faster, more confident decisions. A strong analytics approach shows which menu items drive profit, when labor is out of balance, how customer trends are shifting, and where each location needs attention. In practical terms, it helps restaurant teams stop guessing and start prioritizing the actions most likely to improve revenue, reduce waste, and protect the guest experience.
For example, a busy Friday night may look successful because sales are high. But if labor costs spike, voids increase, popular items run out, and delivery orders create long ticket times, the night may be less profitable than it appears. Hospitality analytics gives managers the fuller picture: not just what happened, but why it mattered.
The best use of analytics is not reviewing reports once a month. It is building a habit of checking the right signals regularly, discussing them with managers, and turning insights into specific operational changes.
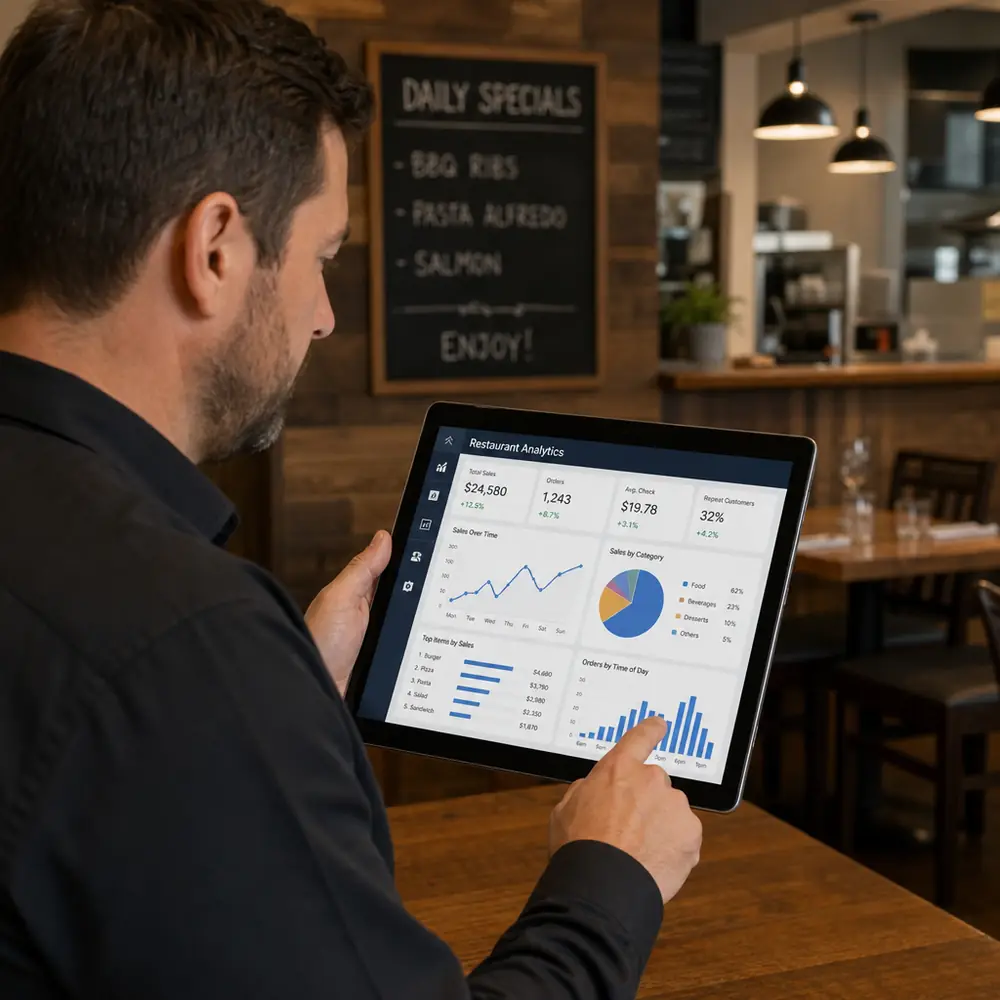
The most important data sources for smarter decisions
Restaurants already generate a huge amount of information. The challenge is bringing that information together in a way that supports action. A restaurant analytics dashboard can help by organizing the most important inputs into one place, making trends easier to spot and compare.
Common sources of restaurant data include:
- POS sales data: Checks, items sold, discounts, refunds, voids, payment types, and sales by time period.
- Menu and recipe data: Ingredient costs, portion standards, contribution margins, modifiers, and item popularity.
- Labor data: Scheduled hours, actual hours, overtime, sales per labor hour, and role-level productivity.
- Inventory data: Purchasing, waste, stockouts, transfers, and variance between expected and actual usage.
- Guest data: Loyalty activity, visit frequency, average spend, feedback, reviews, and customer trends.
- Channel data: Dine-in, takeout, delivery, catering, drive-thru, and third-party marketplace performance.
- Operational data: Ticket times, table turns, order accuracy, manager logs, and service recovery patterns.
When these sources stay separate, teams often make decisions with only part of the story. Sales may suggest an item is a winner, while food analytics may show the margin is too thin. A labor report may show hours are on budget, while guest feedback reveals service is suffering during peak periods. Connected data helps leaders balance financial discipline with guest satisfaction.
Turning restaurant metrics into management habits
Analytics becomes valuable when it changes behavior. A dashboard full of charts is not enough if managers do not know which numbers matter or how to respond. Start with a focused set of restaurant metrics that connect directly to profitability and daily execution.
Useful metrics to monitor include:
- Prime cost: The combined impact of food, beverage, and labor costs, see what is prime cost.
- Sales by daypart: Revenue patterns across breakfast, lunch, dinner, late night, or snack periods.
- Average check: How much guests spend per transaction, including add-ons and modifiers.
- Item contribution margin: The profit each menu item contributes after ingredient costs.
- Menu mix: Which items sell most often and how they affect overall profitability.
- Labor productivity: Sales per labor hour or transactions per employee hour.
- Waste and variance: The gap between expected usage and actual usage.
- Order timing: Prep time, ticket time, delivery handoff time, and drive-thru speed.
- Guest retention: Repeat visits, loyalty engagement, and frequency trends.
The key is assigning ownership. A kitchen manager may own waste and prep variance. A general manager may own labor deployment and guest recovery. A marketing lead may own repeat visits and campaign performance. When each metric has a clear owner, analytics becomes part of the operating rhythm rather than an occasional reporting exercise.
Menu optimization creates profit without guesswork
Menu optimization is one of the clearest ways restaurant analytics can improve profitability. It helps identify which items deserve more visibility, which need pricing adjustments, and which may be slowing down the kitchen without delivering enough return.
A profitable menu is not built only around best sellers. Some popular items have low margins, complex prep, or high waste. Other items may sell less often but contribute strong profit and support the brand experience. Analytics helps operators evaluate each menu item through multiple lenses: popularity, margin, prep complexity, ingredient overlap, speed, and guest response.
Practical menu decisions may include:
- Promote high-margin favorites. Feature items that guests already like and that contribute healthy profit.
- Rework low-margin best sellers. Adjust portioning, ingredients, pricing, or presentation without weakening perceived value.
- Remove operational clutter. Retire items that sell rarely, slow production, or require ingredients used nowhere else.
- Bundle strategically. Pair entrées, sides, beverages, or desserts in ways that increase check size and simplify ordering.
- Track limited-time offers. Compare promotional sales with food cost, labor impact, and repeat purchase behavior.
Food analytics also supports smarter purchasing. If sales patterns show predictable demand by daypart or season, teams can order with more confidence, reduce spoilage, and avoid last-minute substitutions that frustrate guests.
How can analytics reveal customer trends before sales decline?
Analytics can reveal customer trends by showing small changes in behavior before they become obvious in monthly sales. A drop in repeat visits, lower average check, weaker loyalty engagement, fewer add-ons, or negative review patterns can signal that guests are changing how they interact with the restaurant. By watching these indicators early, operators can adjust promotions, menu design, service standards, or staffing before revenue takes a larger hit.
Customer behavior rarely changes all at once. Guests may begin ordering through delivery instead of dining in. They may visit less often but spend more per occasion. They may shift toward value meals, shareable items, healthier options, premium beverages, or faster service formats. Restaurant analytics helps teams see these patterns across channels and locations.
This is especially useful when marketing campaigns are running. Rather than measuring only coupon redemptions or short-term sales, operators can look at whether guests returned, what they ordered next, and whether the campaign attracted profitable behavior. Over time, this creates a clearer connection between marketing activity and long-term guest value.
Quick service restaurant analytics and speed-focused operations
Quick service restaurant analytics often places extra emphasis on speed, consistency, throughput, and order accuracy. In high-volume environments, small delays can affect sales capacity, guest satisfaction, and labor efficiency. Analytics helps QSR teams understand not only how many orders were completed, but where friction appeared in the process.
Important areas for quick service teams include:
- Drive-thru timing: Order point, payment, pickup, and total lane time.
- Kitchen bottlenecks: Items or stations that slow production during rush periods.
- Channel balance: The impact of mobile, kiosk, counter, drive-thru, and delivery orders.
- Accuracy patterns: Recurring mistakes by item, modifier, time of day, or order type.
- Upsell performance: Attach rates for beverages, sides, desserts, and premium options.
For QSR leaders, the benefit is practical. If ticket times rise every weekday between noon and 1 p.m., the answer might be staffing, prep, menu design, equipment flow, or order channel management. Analytics narrows the investigation so managers can test a specific fix instead of reacting with broad assumptions.
Multi-location analytics creates consistency without ignoring local context
Multi location restaurant analytics helps operators compare performance across stores while still respecting the differences between markets, teams, and guest behavior. A single location report may show whether one restaurant improved. A multi-location view shows whether that improvement is isolated, repeatable, or part of a larger trend.
For growing brands, this visibility matters. One restaurant may have unusually high labor costs because of scheduling habits. Another may have strong beverage sales because servers consistently suggest pairings. A third may struggle with delivery reviews because packaging or handoff timing needs attention. Seeing locations side by side helps leaders identify both problems and best practices.
Useful multi-location review questions include:
- Which locations have the strongest margins, and what behaviors support that performance?
- Are food cost issues tied to pricing, waste, theft, training, or supplier changes?
- Which managers consistently improve guest satisfaction while controlling labor?
- Do certain menu items perform differently by region, format, or neighborhood?
- Are promotions lifting sales everywhere, or only in specific markets?
The goal is not to create a culture of blame. It is to make performance visible enough that teams can learn from each other and support locations before issues become expensive.
Restaurant SWOT analytics strengthens strategic planning
Restaurant SWOT analytics applies data to the familiar strengths, weaknesses, opportunities, and threats framework. Instead of filling out a SWOT exercise with opinions alone, operators can support each point with real performance indicators.
A data-informed SWOT might identify strengths such as high repeat visits, strong lunch traffic, efficient labor usage, or profitable signature items. Weaknesses could include high waste, slow service during peak hours, inconsistent review ratings, or low dessert attachment. Opportunities may come from catering demand, underused dayparts, loyalty segmentation, or menu items that deserve stronger placement. Threats may include rising ingredient costs, delivery channel pressure, declining foot traffic, or competitor promotions.
This approach makes strategy more grounded. It also helps teams choose priorities. If the data shows that weekday dinner traffic is soft but lunch is growing, the restaurant may decide to strengthen lunch bundles before investing heavily in a dinner campaign. If guest feedback praises food but criticizes wait times, operational improvement may be more urgent than advertising.
Restaurant video analytics adds operational visibility
Restaurant video analytics can add another layer of insight when used responsibly and in line with applicable privacy and workplace rules. Video-based tools may help operators study traffic flow, queue length, service timing, safety practices, or order handoff issues. When paired with POS and labor data, video insights can explain why certain metrics changed.
For instance, a dashboard may show slower service during a specific rush. Video review may reveal that guests are waiting at pickup because packaging is not ready, staff are crossing paths, or delivery drivers arrive before orders are staged. This kind of visibility can support better layouts, clearer roles, and more realistic staffing plans.
The human side matters. Video analytics should be positioned as a tool for improving systems, not surprising employees with punitive monitoring. Clear policies, transparency, and respectful implementation help protect trust while still improving operations.
What are the key features of restaurant analytics software?
The most useful features of restaurant analytics software are the ones that turn raw data into timely, understandable, and actionable guidance. Operators should look for tools that integrate with core systems, present information clearly, and allow managers to drill into the details behind performance changes. The right platform should make decisions easier, not add another layer of administrative work.
Important features often include:
- Integrated dashboards: A restaurant analytics dashboard should bring together sales, labor, menu, inventory, and guest data in one view.
- Custom reporting: Teams need the ability to filter by location, date, daypart, channel, item, or manager.
- Alerts and exceptions: Automated alerts can flag unusual voids, cost spikes, sales drops, or labor overruns.
- Menu engineering tools: Strong systems help compare popularity, margin, and item performance.
- Labor and sales forecasting: Forecasts support smarter scheduling, prep, and purchasing.
- Multi-location benchmarking: Operators can compare locations and identify repeatable best practices.
- Guest behavior insights: Loyalty, feedback, and ordering patterns help teams understand customer trends.
- Accessible visualizations: Managers should be able to understand the data quickly without needing advanced technical skills.
A good system also encourages action. It should help managers move from “sales were down” to “sales were down during dinner because traffic fell in one channel and average check dropped on bundled items.” That level of clarity supports better decisions. Compare platforms in choosing the best analytics software for restaurants and how restaurant analytics software boosts profits.
A practical rollout plan for analytics-driven restaurants
Restaurants do not need to transform everything at once. In fact, a smaller and more focused start is often more effective. The first goal is to build confidence in the data and prove that better visibility can improve daily decisions.
A simple rollout plan might look like this:
- Define the business goal. Choose one or two priorities, such as reducing food waste, improving labor efficiency, increasing repeat visits, or optimizing the menu.
- Audit current data sources. Identify where sales, labor, inventory, guest, and channel data live today.
- Choose core metrics. Select a focused group of numbers that connect directly to the goal.
- Create a review rhythm. Decide what managers check daily, weekly, and monthly.
- Assign ownership. Make sure each metric has a person responsible for reviewing it and recommending action.
- Test operational changes. Adjust staffing, prep, pricing, menu placement, or promotions based on the findings.
- Measure the result. Compare performance before and after each change, then keep what works.
This process turns analytics into continuous improvement. It also prevents teams from becoming overwhelmed by too many reports at once.
Common mistakes that limit the value of analytics
Even strong data can lead to weak decisions if teams use it poorly. One common mistake is tracking too many metrics without deciding which ones matter most. Another is looking at averages only, which can hide problems by daypart, location, channel, or item category.
Restaurants also risk treating analytics as a back-office activity. If insights never reach the managers who schedule staff, coach servers, order ingredients, or design promotions, the data cannot improve the operation. The most profitable analytics programs connect leadership, managers, and frontline teams around the same priorities.
Avoid these common traps:
- Reviewing reports without assigning follow-up actions.
- Measuring sales without measuring margin.
- Optimizing labor so aggressively that service quality suffers.
- Ignoring guest feedback because financial metrics look acceptable.
- Comparing locations without considering format, market, or traffic differences.
- Using data to criticize teams instead of improving systems.
The point is balance. Analytics should make restaurants more disciplined and more guest-aware at the same time.
Better insight leads to better margins
Restaurant analytics gives operators a clearer path to profitability by connecting financial performance with the real behaviors behind it. From menu optimization and food analytics to quick service restaurant analytics, multi location restaurant analytics, restaurant swot analytics, and restaurant video analytics, the value comes from using data to make practical decisions.
The restaurants that benefit most are not necessarily the ones with the most reports. They are the ones that focus on the right questions, act on what the numbers reveal, and keep refining their approach. When restaurant data becomes part of daily management, profitability becomes less dependent on guesswork and more connected to consistent execution.
For a deeper metrics playbook, see maximizing profitability with restaurant analytics and restaurant profit margins and unit economics. Before you expand locations, validate demand with free analysis at Restaurant Site Finder.
Run a free location analysis
Enter any address to get competitor mapping, market gaps, opportunity scoring, and concept ideas.
Analyze your location free Shop equipment at Horeca Store