Operations
Maximizing Profitability with Restaurant Analytics
Maximizing profitability with restaurant analytics, key metrics, menu strategy, waste and food cost control, labor planning, multi-location comparisons, SWOT analysis, software features, and building data habits.
Key Takeaways
- Restaurant analytics turns everyday POS, labor, inventory, and guest activity into profit decisions, not gut feel alone.
- Focus on metrics that drive action: daypart sales, menu profitability, food and labor cost, inventory variance, and repeat visits.
- Profit improves through many informed adjustments, scheduling, menu mix, purchasing, promotions, and accountability, not one dramatic change.
- Pair operational analytics with unit economics and trade-area screening at Restaurant Site Finder.
Restaurant analytics helps operators turn everyday activity into clearer decisions about sales, staffing, inventory, menus, and guest behavior. Instead of relying on gut feel alone, restaurants can use restaurant data to understand what is working, what is wasting money, and where profit is hiding. The result is a more disciplined operation: better margins, fewer surprises, and a guest experience that improves because decisions are based on real dining insights.
What does restaurant analytics actually help you improve?
Restaurant analytics helps you improve profitability by showing the relationship between revenue, costs, operations, and guest demand. A strong analytics approach connects point-of-sale activity, labor patterns, inventory movement, menu performance, and customer behavior so managers can see causes rather than symptoms. When the right restaurant metrics are monitored consistently, teams can make smaller, faster adjustments before problems become expensive.
For example, a slow Tuesday night is not just "a slow night." It may reveal a staffing mismatch, a weak promotion, a menu item with poor appeal, or a delivery channel that performs better than dine-in during that daypart. Restaurant analytics gives operators the context to respond intelligently instead of cutting costs blindly or chasing every trend.
This matters across the industry, from independent full-service restaurants to quick service restaurant analytics programs built for high-volume, speed-focused operations. Whether the business serves tasting menus, coffee, burgers, tacos, or catering orders, profitability depends on understanding the numbers behind the food.
Profitability starts with better visibility
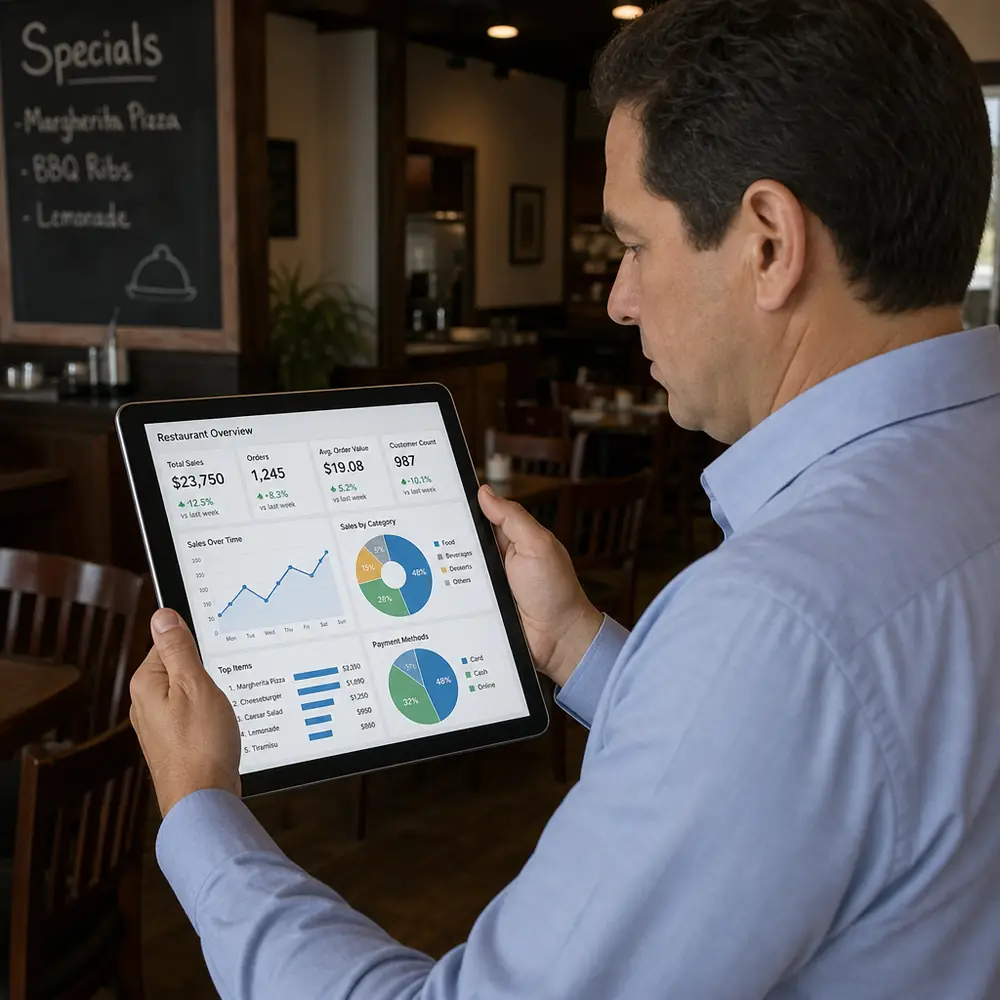
Many restaurants already collect more data than they realize. Orders, modifiers, voids, discounts, reservations, online reviews, loyalty activity, labor hours, waste logs, and purchase invoices all create signals. The challenge is that these signals often live in separate systems, making it hard to see the full story.
A restaurant analytics dashboard brings those signals into one place so owners and managers can spot patterns quickly. Instead of exporting reports from multiple tools, the team can monitor sales, labor, food cost, guest traffic, and item performance in a format that is easier to act on. This visibility is especially valuable when decisions need to happen during service, not three weeks after month-end reports are reviewed.
Good dining analytics does not replace operator instinct. It sharpens it. Experienced managers still understand hospitality, team dynamics, kitchen flow, and guest expectations. Analytics simply gives them a clearer picture of where attention is needed most.
What restaurant metrics deserve regular attention?
Not every number deserves equal focus. A busy dashboard can become a distraction if it overwhelms the team with vanity metrics. The most useful restaurant metrics connect directly to profitability, efficiency, or guest satisfaction.
Key metrics to review consistently include:
- Sales by daypart: Helps identify when demand is strongest and when labor or promotions need adjustment.
- Average check size: Shows whether guests are ordering higher-value items, add-ons, beverages, or desserts.
- Menu item profitability: Reveals which dishes drive margin, not just which ones sell frequently.
- Food cost percentage: Helps track the relationship between ingredient spending and menu pricing.
- Labor cost percentage: Shows whether scheduling aligns with expected sales volume.
- Void, comp, and discount activity: Can uncover training issues, guest recovery patterns, or promotion overuse.
- Inventory variance: Points to waste, theft, portioning inconsistency, or purchasing problems.
- Table turn time or service speed: Connects operational flow to revenue capacity and guest experience.
- Repeat visit behavior: Helps evaluate loyalty efforts, service consistency, and guest retention.
These metrics become more powerful when reviewed together. A menu item with strong sales may still be hurting profit if ingredient costs are high or prep time slows the kitchen. A labor percentage may look high on one day but make sense if a large event required extra staffing. Context is what turns restaurant data into better decisions. Track prime cost weekly, see what is prime cost in restaurant business.
Menu decisions become more strategic
Food analytics gives restaurants a clearer view of how menu choices affect both guest satisfaction and margin. A dish can be popular, profitable, operationally efficient, or brand-defining, but it is not always all four. Analytics helps operators understand which role each item plays.
Menu analysis should consider sales volume, contribution margin, ingredient volatility, prep complexity, waste risk, and guest sentiment. A high-margin appetizer may deserve better placement on the menu or more server attention. A low-margin entrée may need portion review, pricing adjustment, supplier evaluation, or a recipe redesign. A dish with moderate profit but strong emotional appeal may still be worth keeping because it supports the restaurant's identity.
Culinary statistics are useful only when they are interpreted with culinary judgment. A spreadsheet may show that an item is underperforming, but the chef or operator may know it is seasonal, new, poorly described, or dependent on a supplier issue. The best menu decisions combine numbers with kitchen knowledge.
Practical ways to apply menu analytics include:
- Group items by popularity and profitability. Identify stars, hidden opportunities, low performers, and items that need review.
- Review modifiers and add-ons. Extras, sides, sauces, proteins, and beverages often reveal easy ways to increase average check.
- Track waste by ingredient. Ingredients used in only one dish can increase spoilage risk if demand is inconsistent.
- Compare dine-in, takeout, and delivery performance. Some items travel well and protect quality, while others damage the guest experience off-premise.
- Test changes before making permanent moves. Small pricing, description, or placement adjustments can produce meaningful insights without disrupting loyal guests.
How can analytics reduce waste and control food cost?
Analytics reduces waste and controls food cost by connecting purchasing, inventory, production, and sales patterns. When restaurants understand what is being bought, what is being used, what is being thrown away, and what guests are actually ordering, they can forecast more accurately and avoid overproduction. This is one of the most direct ways restaurant analytics supports profit.
Waste often hides in routine behavior. Prep lists may be based on habit rather than current sales trends. Staff may over-portion because portion standards are unclear. Managers may reorder ingredients too early because inventory counts are inconsistent. These issues feel small in the moment, but they add up across weeks and months.
A restaurant analytics dashboard can help identify where losses are likely occurring. If sales of a particular salad are falling but produce purchasing remains unchanged, spoilage may increase. If a protein's theoretical usage does not match actual inventory movement, portioning or waste may need review. If delivery orders spike on rainy evenings, prep planning should adjust to that pattern.
Food cost control is not just about buying cheaper ingredients. It is about aligning purchasing and production with demand while protecting quality. Hospitality analytics should support that balance, helping operators reduce waste without compromising the guest experience.
Labor planning improves when demand is clearer
Labor is one of the most important controllable costs in a restaurant, but it is also one of the easiest to mishandle. Understaffing can damage service, slow the kitchen, increase mistakes, and frustrate employees. Overstaffing can erode profit even on days with decent sales.
Restaurant analytics helps managers schedule based on patterns rather than guesswork. Sales by hour, reservations, weather-sensitive demand, local events, delivery trends, and historical traffic can all inform staffing decisions. In quick service restaurant analytics, where transaction speed and queue management are critical, even small scheduling improvements can affect throughput and guest satisfaction.
Managers can also use analytics to understand productivity. Labor cost percentage tells part of the story, but sales per labor hour, transactions per labor hour, and service times can provide more actionable insight. If a location is spending more on labor but delivering faster service and higher check averages, that may be a smart investment. If labor is high while speed and satisfaction remain weak, training, station design, or scheduling structure may need attention.
Multi-location operators need consistent comparisons
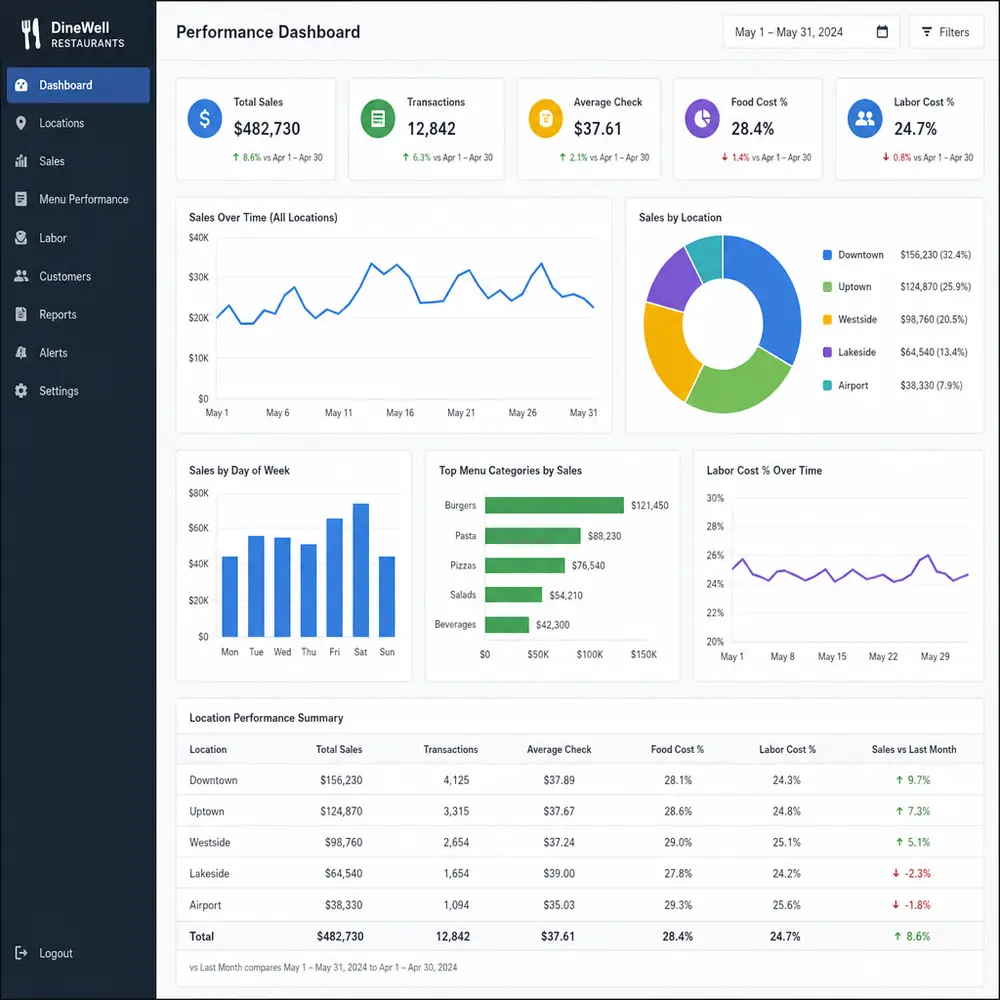
Multi location restaurant analytics adds another layer of value because it lets leaders compare performance across units without relying on anecdotes. One location may be outperforming because of stronger management, better local demand, smarter scheduling, or a different guest mix. Another may be struggling because of menu execution, inconsistent service, or higher waste.
The goal is not to punish lower-performing locations. It is to identify what can be learned and repeated. If one restaurant consistently sells more high-margin items, leaders can study its menu placement, staff training, local promotions, or guest demographics. If another has unusually low waste, its prep process may deserve attention across the group.
Useful comparisons for multi-location teams include:
- Sales by daypart and channel
- Food cost and inventory variance
- Labor efficiency and scheduling accuracy
- Menu mix and item-level profitability
- Guest ratings and complaint themes
- Discount usage and comp patterns
- Speed of service or table turn performance
Consistency matters. If each location tracks metrics differently, comparisons become unreliable. Standard definitions, shared reporting formats, and disciplined data entry help make the numbers trustworthy.
SWOT analysis becomes stronger with real data
Restaurant swot analytics applies data to the familiar strengths, weaknesses, opportunities, and threats framework. Instead of filling out a SWOT exercise based only on opinion, operators can use restaurant data to support each category with evidence.
A strength might be a high repeat-visit rate, strong beverage attachment, or excellent dinner sales. A weakness might be rising food cost, high turnover during lunch, or low conversion on online ordering. An opportunity could be an underpromoted catering program, growing demand for a specific cuisine category, or a profitable item that deserves more visibility. A threat might include ingredient cost pressure, declining traffic in a certain daypart, or a competitor capturing delivery demand.
This type of analysis is especially useful during planning periods. It helps owners move from vague goals like "increase sales" to targeted priorities such as improving lunch traffic, reducing prep waste, training servers on add-ons, or revising delivery menu options. The more specific the insight, the easier it becomes to take action.
What features make analytics software useful?
The best features of restaurant analytics software are the ones that make decisions easier, faster, and more reliable. A system does not need to be complicated to be valuable, but it should help the team move from reporting to action.
Important features to look for include:
- Custom dashboards: Managers should be able to see the metrics that matter most to their role or location.
- POS and inventory integration: Connected systems reduce manual work and make insights more complete.
- Menu item analysis: Operators need visibility into both popularity and profitability.
- Labor reporting: Scheduling decisions improve when sales and staffing are viewed together.
- Multi-location views: Group operators need consistent comparisons across restaurants.
- Alerts and exceptions: Unusual discounts, waste spikes, or sales drops should be easy to spot.
- Channel reporting: Dine-in, takeout, delivery, catering, and online ordering may behave very differently.
- Easy export and sharing: Insights should be simple to discuss with managers, chefs, accountants, and ownership.
Usability matters as much as functionality. If only one person understands the reporting tool, the restaurant will struggle to create a data-driven culture. A practical platform should help busy operators find answers quickly, not bury them under unnecessary complexity. Compare options in choosing the best analytics software for restaurants and how restaurant analytics software boosts profits.
What should restaurants do first with their data?
Restaurants should start by choosing a small set of high-impact metrics, cleaning up the data behind them, and reviewing those numbers on a consistent schedule. Trying to analyze everything at once usually leads to confusion. A focused start builds confidence and creates early wins.
A practical first step is to select one profitability goal and one operational goal. For example, a restaurant might focus on reducing food waste while improving average check size. That keeps the team aligned and makes it easier to decide which reports matter.
A simple starter plan could look like this:
- Define the goal. Choose a clear priority such as improving margin, reducing waste, increasing lunch sales, or improving labor efficiency.
- Identify the data sources. Determine which systems hold the relevant POS, inventory, labor, reservation, or loyalty data.
- Standardize definitions. Make sure the team agrees on how metrics are calculated and interpreted.
- Build a review rhythm. Daily dashboards, weekly manager reviews, and monthly strategy discussions can serve different purposes.
- Assign ownership. Each metric should have someone responsible for monitoring it and recommending action.
- Test one change at a time. Adjust menu placement, staffing, prep levels, or promotions carefully so results are easier to understand.
- Document what worked. Good insights should become repeatable processes, not one-time observations.
This approach keeps analytics practical. The goal is not to admire reports. The goal is to make better decisions more often.
Turning insight into daily habits
Analytics becomes profitable when it changes behavior. A dashboard that no one reviews will not improve margins. A report that identifies waste but does not lead to purchasing or prep changes is only a missed opportunity in a different format.
The most successful teams make data part of their operating rhythm. A shift meeting can include one quick insight about yesterday's sales or today's focus item. A weekly manager meeting can review labor alignment, menu mix, and guest feedback. A monthly ownership meeting can look at broader hospitality analytics trends and decide where to invest time, training, or marketing.
It also helps to frame analytics as support rather than surveillance. Staff may resist numbers if they feel data is only used to criticize performance. When managers use insights to improve training, reduce chaos, prepare more accurately, and create smoother service, the team is more likely to engage.
Better data supports better hospitality
The purpose of restaurant analytics is not to make restaurants feel less human. It is to help operators protect the human parts of hospitality by making the business stronger. When managers understand demand, kitchens prep with more confidence, servers receive better coaching, guests get more consistent experiences, and owners make decisions with fewer blind spots.
Profitability rarely improves from one dramatic change. More often, it improves through many informed adjustments: a smarter schedule, a cleaner menu, tighter purchasing, better promotion timing, stronger add-on strategy, and clearer accountability. Restaurant analytics brings those opportunities into view.
For restaurants ready to compete with more confidence, the path forward is straightforward: gather the right data, focus on the metrics that matter, turn insights into action, and keep refining. The numbers will not run the restaurant for you, but they can show you where to lead next. Pair with maximizing efficiency with restaurant analytics software for operational depth.
Frequently Asked Questions
What does restaurant analytics help you improve?
Profitability by connecting revenue, costs, operations, and guest demand, so managers see causes not symptoms. Analytics reveals staffing mismatches, weak promotions, menu items with poor appeal, and channel performance differences instead of cutting costs blindly.
What restaurant metrics deserve regular attention?
Sales by daypart, average check, menu item profitability, food and labor cost percentages, voids and discounts, inventory variance, service speed, and repeat visit behavior, reviewed together for context, not in isolation.
How can analytics reduce waste and control food cost?
By connecting purchasing, inventory, production, and sales patterns. When theoretical usage does not match actual movement, or purchasing stays flat while sales fall, analytics flags portioning issues, spoilage, and prep habits that need adjustment.
What features matter most in restaurant analytics software?
Custom dashboards, POS and inventory integration, menu item analysis, labor reporting, multi-location views, exception alerts, channel reporting, and easy sharing, plus usability so busy managers can act without drowning in complexity.
What should restaurants do first with their data?
Choose a small set of high-impact metrics, standardize definitions, set a review rhythm, assign ownership, and test one change at a time against a clear profitability or operational goal, rather than trying to analyze everything at once.
Run a free location analysis
Enter any address to get competitor mapping, market gaps, opportunity scoring, and concept ideas.
Analyze your location free Shop equipment at Horeca Store