Operations
How To Use Data Analytics to Improve Your Restaurant Revenue
How to use data analytics to improve restaurant revenue, POS, menu, labor, and guest data; core metrics; menu and pricing analytics; forecasting, marketing, revenue tools, weekly routines, and common mistakes.
Key Takeaways
- Restaurant data analytics turns POS, labor, inventory, and guest signals into revenue actions, not unused dashboards.
- Track a focused set of performance metrics weekly with comparable dayparts and channels.
- Menu, pricing, forecasting, and marketing analytics protect margin and guest value when tied to one or two clear changes.
- Screen locations free at Restaurant Site Finder; deepen ops with leveraging data for restaurant success.
Data analytics can turn everyday restaurant activity into practical decisions that improve revenue. Instead of guessing which menu items to promote, when to staff up, or why sales dip on certain nights, restaurant analytics helps you see patterns in orders, labor, guests, inventory, and marketing. The goal is not to drown your team in dashboards; it is to use clear restaurant performance metrics to make better choices more often.
Whether you run a quick-service concept, a full-service dining room, a café, a bar, or a multi-location operation, the same principle applies: better information supports better revenue growth strategies. With the right revenue management tools and a simple review routine, analytics for restaurants can help you protect margins, increase guest value, and spot missed opportunities before they become expensive habits.
What does restaurant data analytics actually help you improve?
Restaurant data analytics helps you improve revenue by showing what drives sales, what drains profit, and where guest behavior is changing. It connects the dots between your POS, menu mix, labor, reservations, delivery channels, marketing campaigns, and inventory so you can make decisions based on evidence instead of instinct alone.
At its best, analytics gives operators a practical view of cause and effect. If a popular item sells well but has high food cost, the data may suggest a recipe adjustment, price review, or portion control check. If Friday sales look strong but labor costs climb faster than revenue, the issue may not be demand; it may be scheduling, station design, or service flow.
This is why learning how to use data analytics to improve your restaurant revenue is more than a technical topic. It is an operating mindset. You are using the numbers your restaurant already creates to answer questions like:
- Which menu items bring in revenue and margin?
- Which dayparts have unused sales potential?
- Which guest segments return often, spend more, or respond to offers?
- Which promotions drive profitable orders rather than discounted traffic?
- Which costs are rising quietly in the background?
- Which locations, channels, or service periods need attention first?
The value comes from turning these answers into action. Data that never changes a decision is just reporting. Useful data leads to testing, training, pricing updates, menu refinement, and more confident planning.
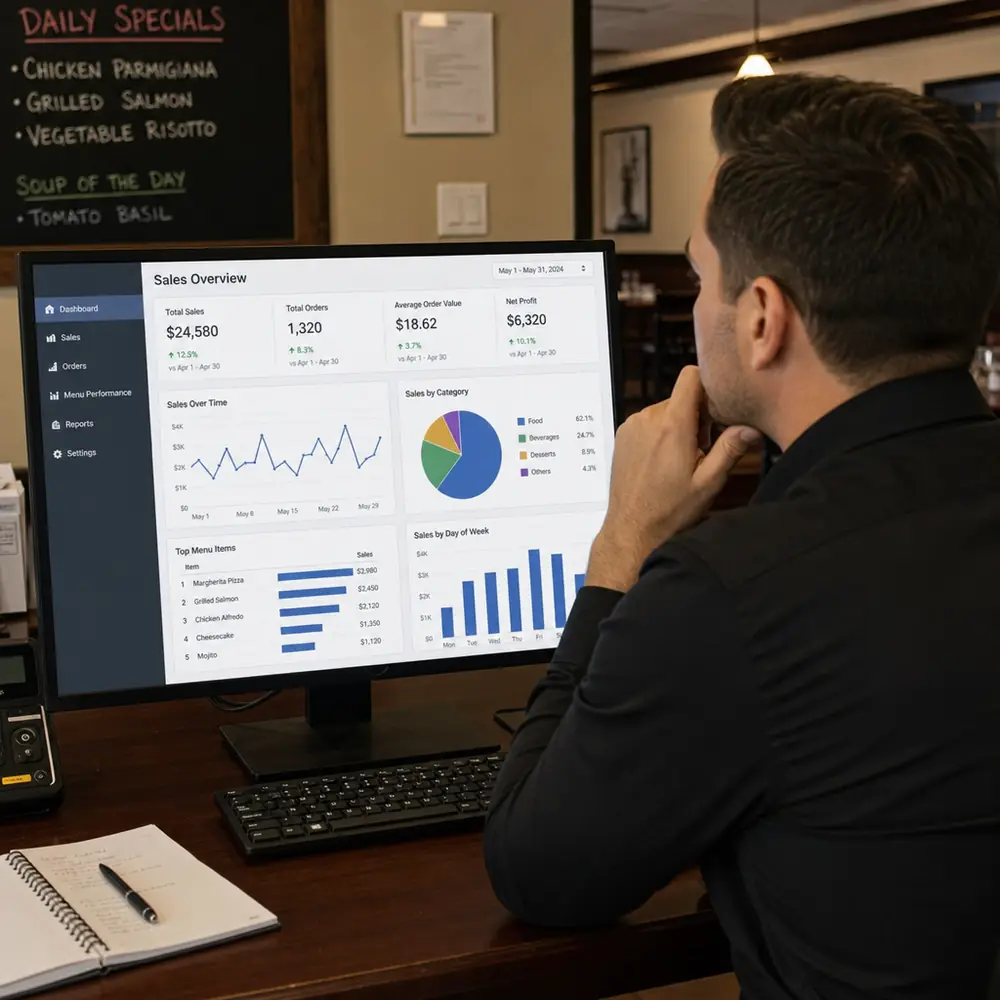
The data sources that matter most
Most restaurants already collect useful information, even if it lives in separate systems. Your point-of-sale system is the obvious starting point, but it is only one part of the picture. Strong analytics for restaurants usually combines sales, cost, labor, guest, and operational data.
POS and order data
Your POS shows what guests buy, when they buy it, how much they spend, and which channels they use. This data helps you understand average check size, item popularity, modifiers, discounts, voids, comps, and sales by hour or daypart.
Look beyond total sales. A busy Saturday night can hide weak item margins, slow table turns, or over-discounting. POS data becomes more valuable when you separate revenue by dine-in, takeout, delivery, catering, bar, private events, or online ordering.
Menu and inventory data
Menu data tells you what sells. Inventory data tells you what those sales cost. When you connect the two, you can see whether your best-selling items are also helping profitability.
This is essential for revenue optimization because high sales volume is not always the same as strong financial performance. A dish with expensive ingredients, inconsistent portions, or heavy waste may need a different strategy than an item with strong margins and reliable prep execution.
Labor and scheduling data
Labor is one of the biggest controllable costs in many restaurant operations. Analytics can show whether your staffing levels match demand or whether you are routinely overstaffed during slow periods and understaffed during peaks.
Labor data becomes especially useful when reviewed alongside sales by hour. If revenue spikes between 6 p.m. and 8 p.m., but service slows because the kitchen is short on prep or the floor lacks support, the issue affects both guest experience and revenue potential.
Guest and marketing data
Loyalty programs, reservations, email campaigns, online ordering accounts, and guest feedback tools can reveal who visits, how often they return, what they prefer, and which offers motivate them. This data supports more precise revenue growth strategies because it helps you avoid treating every guest the same.
For example, a frequent lunch guest may respond to a weekday bundle, while a weekend dinner guest may be more interested in a seasonal feature, wine pairing, or group reservation prompt. Better segmentation can make marketing feel more relevant and less dependent on broad discounts.
Core restaurant performance metrics to track
You do not need dozens of metrics to make smarter decisions. In fact, too many numbers can slow down action. Start with a focused set of restaurant performance metrics that connect directly to revenue, cost, and guest behavior.
A practical starting dashboard may include:
- Total sales by daypart: Shows when revenue is earned and where slow periods may need attention.
- Average check size: Helps you understand guest spending and the impact of upselling, menu design, and pricing.
- Guest count or order count: Separates revenue growth from price increases so you can see whether traffic is rising or falling.
- Sales by channel: Compares dine-in, takeout, delivery, catering, and online ordering performance.
- Menu item sales mix: Shows which items are most popular and which may be underperforming.
- Food cost by item or category: Helps identify margin pressure and recipe issues.
- Labor cost as a share of sales: Reveals whether staffing aligns with revenue patterns.
- Table turn time or service duration: Supports capacity planning in full-service restaurants.
- Discount and comp usage: Shows whether promotions are controlled and profitable.
- Repeat guest behavior: Helps measure loyalty, retention, and marketing effectiveness.
The key is consistency. Review these metrics on a regular schedule and compare them against similar periods. A Monday lunch should not be judged against a Saturday dinner. A holiday week should not be treated like a normal week. Context keeps the data useful. Track prime cost alongside sales for a fuller margin picture.
Menu analytics can reveal hidden revenue opportunities
Your menu is one of your strongest revenue levers, and data can show where small changes may have a meaningful impact. Menu analytics helps you understand which items deserve more visibility, which need recipe or price review, and which may be creating complexity without enough return.
Start by grouping items into practical categories:
- Popular and profitable items: These are your menu heroes. Feature them in menu placement, server recommendations, online ordering photos, and limited-time bundles.
- Popular but low-margin items: These need a closer look. You may need to adjust pricing, portioning, ingredient sourcing, or prep process.
- Profitable but under-ordered items: These may need better descriptions, menu placement, staff training, or promotion.
- Low-popularity and low-margin items: These are candidates for removal, redesign, or seasonal replacement.
This exercise does not require a complicated system at first. Even a basic export from your POS combined with food cost information can show patterns. The important part is not to make menu decisions based only on personal preference or anecdotal feedback.
Menu analytics also helps reduce operational friction. If an item sells poorly but requires special ingredients, extra prep, and kitchen training, it may be costing more than the sales report suggests. Removing or simplifying that item can improve speed, reduce waste, and make room for better performers.
How can analytics improve pricing without alienating guests?
Analytics can improve pricing by showing where guests see value, which items can support a change, and where price sensitivity may be higher. Instead of applying the same increase across the whole menu, you can make targeted adjustments based on demand, margin, item role, and guest behavior.
Start with contribution margin, not just item cost. An item with a higher food cost percentage may still contribute meaningful dollars if guests order it often and it supports the overall dining experience. On the other hand, a lower-cost item that rarely sells may not deserve menu space.
Good pricing decisions also consider menu architecture. Some items act as entry points, some encourage add-ons, and others position your restaurant as premium. Data can help you understand these roles. For example, if guests regularly add a side, sauce, protein, dessert, or beverage to a certain entrée, the total check impact may be more important than the entrée price alone.
A thoughtful pricing review may include:
- Comparing item sales before and after small price changes.
- Watching whether guests shift to different items when prices move.
- Reviewing modifiers and add-ons that increase average check size.
- Tracking delivery pricing separately from dine-in pricing when costs differ.
- Testing bundles or prix fixe options during slower periods.
- Training staff to explain value, ingredients, and recommendations confidently.
Revenue optimization is not about charging the most possible. It is about aligning price, value, cost, and demand so the business remains healthy while guests still feel good about the experience.
Forecasting makes staffing and purchasing smarter
Forecasting is one of the most practical uses of restaurant analytics. When you can predict likely demand with more confidence, you can schedule labor, prep food, and order inventory more efficiently.
A good forecast considers more than last week’s sales. It may include seasonality, local events, weather patterns, holidays, reservations, catering orders, promotions, and school or business calendars. You do not need perfect prediction to benefit. Even a modest improvement in planning can reduce waste, avoid shortages, and improve service readiness.
For labor, forecasting helps managers build schedules around expected demand rather than habit. If Tuesday dinner has changed over time because of a new event, competitor, delivery trend, or neighborhood pattern, the schedule should reflect that. If Sunday brunch demand is strong but bar sales lag, staffing may need to shift by station rather than simply adding more people.
For inventory, forecasting supports tighter purchasing. Over-ordering can lead to spoilage, waste, and tied-up cash. Under-ordering can lead to 86’d items, disappointed guests, and missed revenue. Analytics helps find the balance by showing how sales patterns translate into prep needs.
Marketing analytics turns promotions into learning
Restaurant promotions can bring in traffic, but traffic alone does not guarantee profit. Marketing analytics helps you understand which campaigns bring valuable guests, which offers create repeat visits, and which discounts simply reduce revenue you would have earned anyway.
Instead of judging a campaign only by redemptions, look at the full picture:
- Did the promotion increase total orders or shift existing orders to a discount?
- What was the average check for promoted guests?
- Did guests add full-price items?
- Did first-time guests return later?
- Which channel produced the strongest response?
- Did the promotion create operational strain during peak hours?
These questions help you refine offers. A blanket discount may not be the best answer if your goal is repeat visits, higher check size, or off-peak demand. You might test a targeted lunch offer, a limited-time menu item, a loyalty reward, a catering reminder, or an add-on incentive instead.
Analytics also helps connect marketing to capacity. If your dining room is already full on Saturday night, promoting that time may only compress demand and strain service. A better strategy might focus on early evening, weekday lunch, late-night, takeout, or private events.
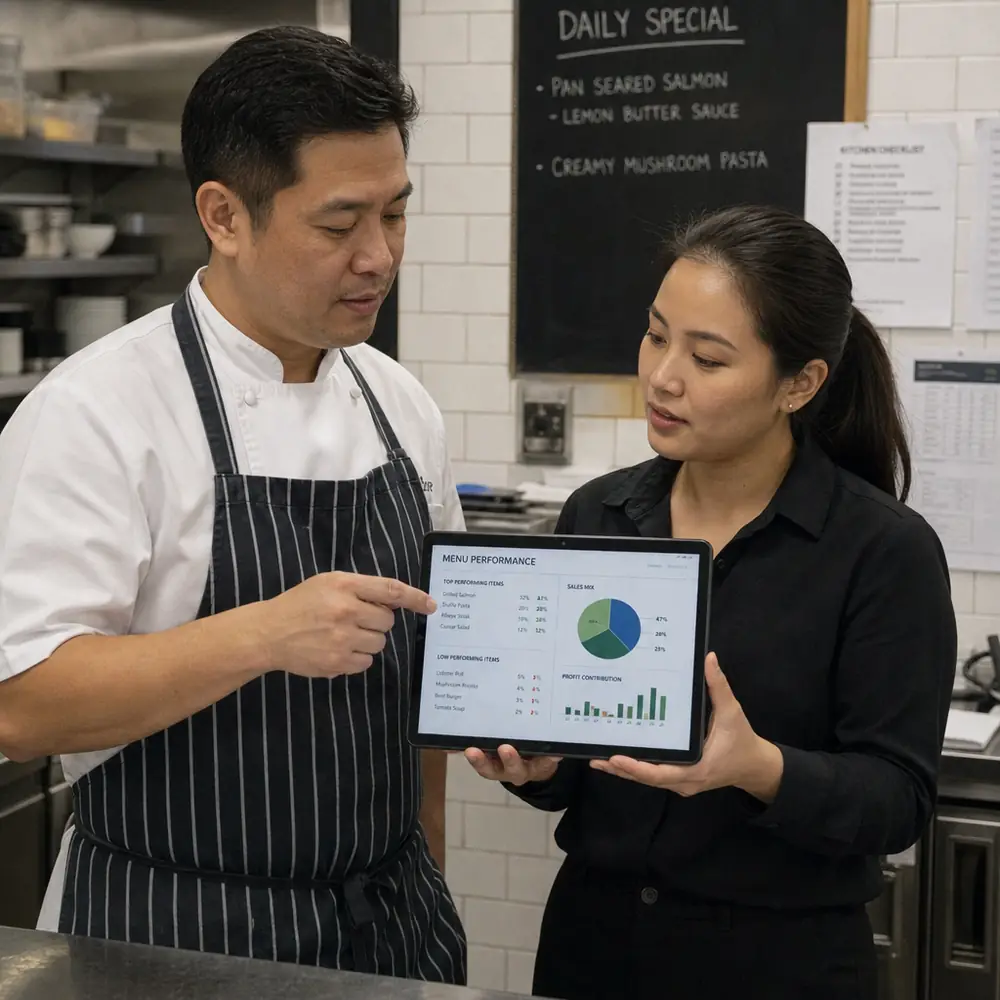
Revenue management tools can simplify the process
Revenue management tools help collect, organize, and interpret the data you need for better decisions. Depending on your restaurant, this might include POS reporting, inventory software, scheduling platforms, reservation systems, customer relationship tools, delivery dashboards, accounting reports, or dedicated analytics platforms.
The best tool is not always the most complex one. It is the one your team will actually use. A clear dashboard that shows sales, labor, menu mix, and guest behavior in one place can be more valuable than a sophisticated system that no one reviews.
When evaluating revenue management tools, consider whether they can help you:
- Pull data from the systems you already use.
- View performance by location, daypart, channel, and menu category.
- Track trends over time instead of only daily snapshots.
- Flag unusual changes in sales, cost, or labor.
- Support forecasting for staffing and purchasing.
- Create simple reports managers can act on quickly.
- Compare promotions, menu changes, or pricing tests.
It is also important to assign ownership. If everyone can see the data but no one is responsible for using it, insights may go nowhere. Decide who reviews which metrics, how often they review them, and what actions should follow.
A practical weekly analytics routine
Data becomes more powerful when it is part of your management rhythm. A weekly review keeps the process manageable and helps the team make steady improvements without waiting for a crisis.
Use this simple routine:
- Review top-line revenue: Compare sales, guest count, average check, and order volume against the previous comparable period.
- Check sales by daypart and channel: Identify where revenue grew, softened, or shifted.
- Scan menu performance: Look for items that gained momentum, lost demand, or created margin concerns.
- Review labor alignment: Compare scheduled hours, actual hours, and sales patterns.
- Check inventory exceptions: Note waste, shortages, high-cost items, or unusual purchasing changes.
- Evaluate promotions: Review whether current offers are driving profitable behavior.
- Choose one or two actions: Avoid trying to fix everything at once. Pick focused changes and measure the result.
The final step matters most. A weekly meeting that ends with no action is only a reporting session. A useful analytics routine should produce decisions, such as adjusting prep levels, coaching servers on a high-margin item, changing a delivery menu photo, testing a new lunch bundle, or revising next week’s schedule.
Turning insights into revenue growth strategies
Data does not grow revenue by itself. It informs revenue growth strategies that your team can execute in the real world. The strongest strategies usually combine operational discipline with guest-focused improvements.
Here are several ways to translate insights into action:
- Increase average check thoughtfully: Use data to identify popular add-ons, beverages, sides, desserts, and upgrades. Train staff to recommend items that fit the guest experience rather than pushing random upsells.
- Strengthen off-peak sales: Look for slow dayparts with available capacity. Test targeted offers, events, bundles, or online-ordering prompts that build demand without crowding peak periods.
- Improve menu visibility: Promote profitable items through menu placement, descriptions, photos, staff recommendations, and digital ordering layout.
- Reduce preventable waste: Use sales patterns to refine prep lists, purchasing quantities, and batch sizes.
- Protect service quality during peaks: Forecast demand and schedule the right roles at the right times so busy periods generate revenue without damaging guest experience.
- Segment guest communication: Send more relevant messages based on visit patterns, preferences, or ordering behavior.
- Test before making broad changes: Use small experiments to evaluate pricing, menu placement, bundles, or promotions before rolling them out widely.
These strategies work best when they are measured. If you change a menu description, monitor sales mix. If you launch a weekday offer, track average check and repeat visits. If you adjust staffing, watch service speed, labor cost, and guest feedback together.
Common mistakes to avoid
Restaurant analytics is useful, but it can create confusion if the team focuses on the wrong signals. Avoid treating data as a replacement for judgment. Numbers are most valuable when paired with what managers, servers, kitchen staff, and guests are experiencing day to day.
Common mistakes include:
- Tracking too many metrics: A crowded dashboard can hide the few numbers that matter most.
- Looking only at sales: Revenue without cost context can lead to poor decisions.
- Ignoring channel differences: Dine-in, delivery, takeout, and catering may have different margins and guest expectations.
- Overreacting to short-term changes: One unusual night should not drive a major strategy shift.
- Discounting without analysis: Promotions should be measured by profitability and guest behavior, not just redemption count.
- Failing to train the team: Managers and staff need to understand what the numbers mean and how their actions influence them.
The best operators use analytics as a conversation starter. If a metric changes, they ask why, look for supporting evidence, and choose a practical response.
Data works best when it supports hospitality
Restaurants are human businesses. Guests do not return because a spreadsheet is clean; they return because the food, service, value, and atmosphere feel worth repeating. The purpose of data is to support those experiences, not replace them.
When used well, restaurant analytics helps teams make decisions that guests can feel. Better forecasting means fewer sold-out favorites. Smarter scheduling means smoother service. Menu analysis can highlight dishes guests love and help remove items that slow the kitchen down. Marketing data can make offers more relevant instead of noisy.
The most sustainable approach is simple: collect the right data, review it consistently, turn it into action, and measure what happens next. Over time, those small improvements can shape stronger margins, better guest experiences, and more confident revenue optimization.
If you are just starting, do not wait for a perfect system. Choose a few restaurant performance metrics, review them every week, and connect each insight to a clear decision. That is how analytics for restaurants becomes more than reporting; it becomes a practical tool for better revenue management and long-term growth. See also boost profits with effective restaurant analytics and restaurant profit margins and unit economics.
Run a free location analysis
Enter any address to get competitor mapping, market gaps, opportunity scoring, and concept ideas.
Analyze your location free Shop equipment at Horeca Store