Operations
Leveraging Data for Restaurant Success
Learn how restaurant business intelligence turns POS, labor, inventory, and guest data into actionable strategies for menu engineering, waste reduction, staffing, and multi-unit growth.
Key Takeaways
- Restaurant business intelligence connects POS, BOH, labor, and CRM data into a unified dashboard for proactive decision-making.
- Track prime cost, RevPASH, table turn rate, and customer lifetime value to protect razor-thin margins.
- Menu engineering, inventory analytics, and predictive staffing are the fastest paths to higher profitability.
- Pair operational BI with free location intelligence at Restaurant Site Finder.
The restaurant industry has always been a delicate balancing act. Between fluctuating food costs, unpredictable foot traffic, and the ongoing challenge of staff retention, relying purely on gut instinct is no longer a viable business strategy. Today, the most successful operators are those who have embraced a data-driven approach to every aspect of their business.
Welcome to the era of restaurant business intelligence (BI). In a sector where profit margins are famously razor-thin, leveraging data is the ultimate differentiator between a restaurant that merely survives and one that consistently thrives.
Whether you run a single neighborhood bistro or manage a sprawling national chain, understanding how to harvest, analyze, and act upon your data is the key to unlocking sustainable growth. In this comprehensive guide, we explore the depths of business intelligence in restaurant industry operations, break down essential metrics, and provide actionable strategies to transform your raw data into a more profitable bottom line.
Decoding Restaurant Business Intelligence
At its core, restaurant business intelligence refers to the technologies, applications, and practices used for the collection, integration, analysis, and presentation of business information. But what does that actually mean for a restaurateur?
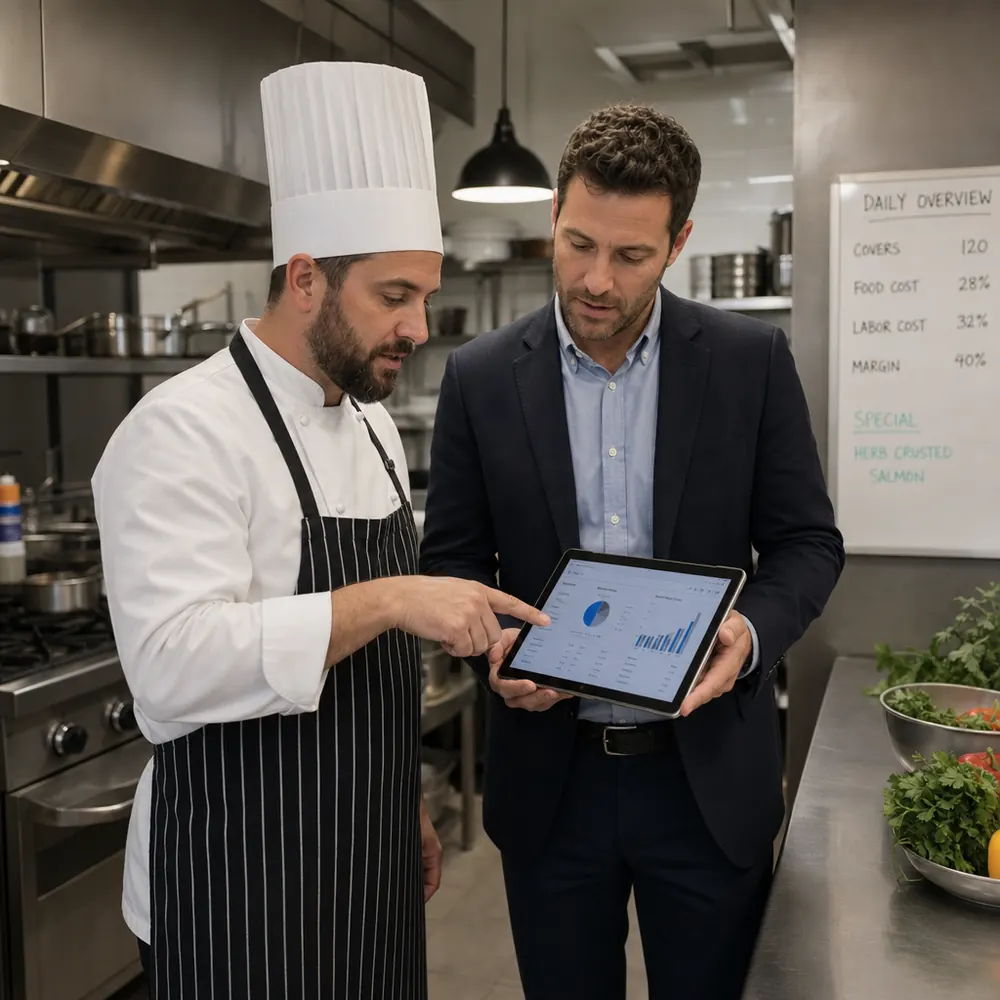
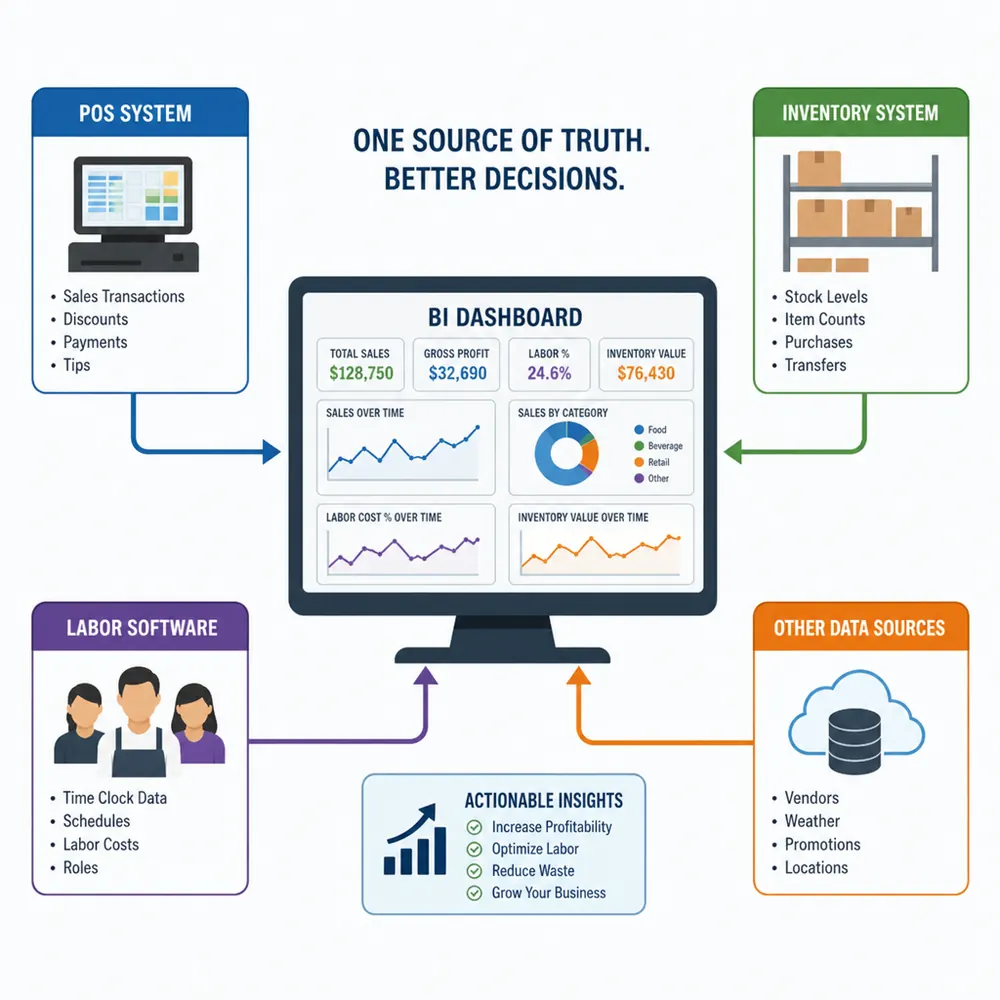
In the past, managers would look at a printed end-of-day sales report and try to guess what went right or wrong. Today, hospitality analytics goes much deeper. It involves pulling data from various touchpoints, your Point of Sale (POS) system, employee scheduling software, inventory management tools, and even social media, into a centralized hub.
This convergence of data allows operators to move from reactive decision-making to proactive strategy. With robust restaurant analytics, you aren't just seeing what happened; you are uncovering why it happened and what will likely happen next.
The Shift to Modern Food Service Analytics
The evolution of food service analytics has changed the daily routine of restaurant operators. Historically, analyzing performance meant spending hours buried in paperwork. Today, the debate of an automated restaurant dashboard vs manual spreadsheets has a clear winner.
Manual spreadsheets are prone to human error, time-consuming to update, and quickly become outdated. An automated dashboard, on the other hand, provides a live, dynamic view of your operations. It visualizes complex data sets into easily digestible charts and graphs, alerting you to anomalies, like a sudden spike in overtime or a missing inventory delivery, the moment they occur.
Building Your Foundation: A Guide to Setting Up a Restaurant Data Stack
Before you can start mining your data for gold, you need the right infrastructure. Creating a cohesive technology ecosystem is critical. Here is a practical guide to setting up a restaurant data stack that will serve as the foundation for your analytics initiatives.
1. Centralize Your Point of Sale (POS)
Your POS is the beating heart of your restaurant's data. Proper POS system integration for reporting is the first and most crucial step in building your stack. Modern POS systems capture every transaction, modifier, discount, and void. Ensure your POS features an open API (Application Programming Interface) so it can seamlessly share this data with your BI tools.
2. Connect Back-of-House (BOH) Systems
Your data stack must include your inventory management and procurement software. By linking BOH systems with your POS, you can track theoretical versus actual food costs, monitor recipe profitability, and trigger automatic reordering.
3. Integrate Labor Management Tools
Labor is typically a restaurant's highest controllable expense. Integrating your time-and-attendance and scheduling software into your data stack allows you to overlay sales data with labor data, giving you a crystal-clear picture of your operational efficiency.
4. Incorporate Marketing and CRM Data
To understand your guests fully, plug your reservation platforms, loyalty programs, and Customer Relationship Management (CRM) tools into your data warehouse. This completes the loop, allowing you to connect what is happening in the kitchen to who is sitting in the dining room.
The Core Metrics: What Are the Best Restaurant KPIs to Track?
With your data stack in place, you will quickly find yourself swimming in a sea of numbers. The challenge is knowing which numbers actually matter. If you find yourself asking, "what are the best restaurant KPIs to track?", you are not alone.
While every concept is different, certain food industry metrics are universally critical for evaluating restaurant performance. Here is a breakdown of the essential restaurant KPIs (Key Performance Indicators) you must monitor:
Prime Cost
Your prime cost is the granddaddy of all restaurant KPIs. It is the sum of your Cost of Goods Sold (COGS) and your total labor costs (including taxes, benefits, and insurance). Ideally, a healthy restaurant should keep its prime cost between 55% and 60% of total sales. If this number creeps higher, your profitability is in immediate danger.
Learn more in our prime cost glossary entry.
RevPASH (Revenue Per Available Seat Hour)
A highly effective metric borrowed from the broader world of hospitality analytics, RevPASH tells you how effectively you are monetizing your dining room space.
Formula: Total Revenue / (Available Seats × Opening Hours)
Tracking RevPASH helps you understand if you need to turn tables faster during peak hours or run promotions to fill seats during slow periods.
Table Turn Rate
This measures the average time a party occupies a table from the moment they sit down to the moment it is bussed for the next guest. While you want guests to feel relaxed, an agonizingly slow turn rate on a Friday night bottlenecks your revenue.
Customer Acquisition Cost (CAC) and Retention Rate
How much does it cost your marketing department to bring a new diner through the doors? More importantly, how many of those diners come back? Tracking retention alongside CAC is vital for long-term growth.
Actionable Strategies: How to Improve Restaurant Profit Margins with Data
Having data is good; using it to make money is better. Once you are tracking the right metrics, the next step is applying restaurant business intelligence analytics to drive real-world changes. Here is a deep dive into how to improve restaurant profit margins with data.
The Menu Engineering Matrix for Profitability
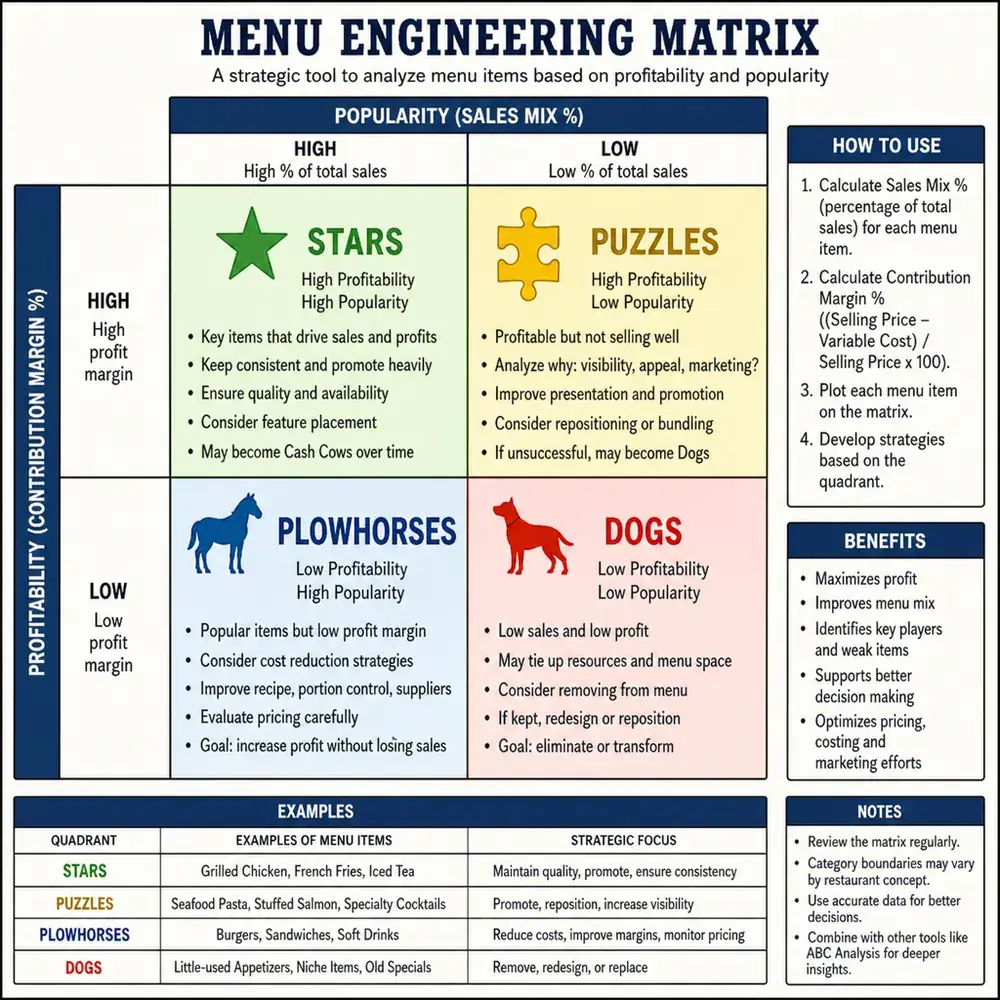
Your menu is your primary sales tool. Treating it as a static document is a massive missed opportunity. By utilizing a menu engineering matrix for profitability, you can categorize every item on your menu based on two factors: popularity (sales volume) and profitability (contribution margin).
When you run your menu data through restaurant business intelligence software, items will fall into one of four categories:
- Stars (High Profit, High Popularity): These are your signature dishes. Keep them consistent, promote them heavily, and never bury them in the back of the menu.
- Plowhorses (Low Profit, High Popularity): People love these items, but they don't make you much money. Try slightly reducing portion size, substituting a cheaper side dish, or carefully raising the price.
- Puzzles (High Profit, Low Popularity): These items have great margins but aren't selling. Do they need a better menu description, better placement, or a server push as specials?
- Dogs (Low Profit, Low Popularity): These items take up valuable prep time and inventory space without delivering a return. Unless they serve a specific dietary need, remove them from the menu.
Reducing Food Waste Through Inventory Analytics
Food waste is a silent killer of restaurant margins. It happens through over-portioning, spoilage, theft, and over-ordering. Reducing food waste through inventory analytics is one of the fastest ways to inject cash back into your business.
By relying on restaurant business intelligence analytics software, you can track the variance between your theoretical inventory (what your POS says you should have used based on sales) and actual inventory (what is physically left on the shelves).
If your data shows you are consistently throwing away 15% of your fresh produce every week, you can immediately adjust your procurement strategy. Advanced systems will even suggest order quantities based on historical depletion rates and upcoming forecasts.
Optimizing Labor Cost Percentages and Staffing
Next to food, labor is your biggest expense. Traditional scheduling relies on managers guessing how busy a Tuesday night will be. This leads to either overstaffing or understaffing.
Optimizing labor cost percentages requires a more scientific approach through predictive demand forecasting for staffing.
Top-tier restaurant business intelligence platforms ingest historical sales data, local weather forecasts, local events, and seasonal trends to predict exactly how many staff members you will need on the floor at any given hour.
Real-Time Sales Performance Tracking
In the past, operators wouldn't know they had a terrible sales day until they ran the reports after closing. Real-time sales performance tracking changes the game.
Imagine it is 6:00 PM on a Friday. Your automated dashboard shows that sales are trending 20% below your historical average. Because you have this information in real-time, you can take immediate action, instruct your host to accept more walk-ins, prep fewer perishable items, or send a busser home early to save on labor costs.
Enhancing the Guest Experience and Marketing
While restaurant analytics are incredibly powerful for controlling costs, they are equally potent for driving top-line revenue and enhancing the guest experience.
Guest Sentiment Analysis Across Platforms
Your customers are talking about you online, but reading every single Yelp, Google, and TripAdvisor review is impossible for a busy operator. This is where guest sentiment analysis across platforms comes into play.
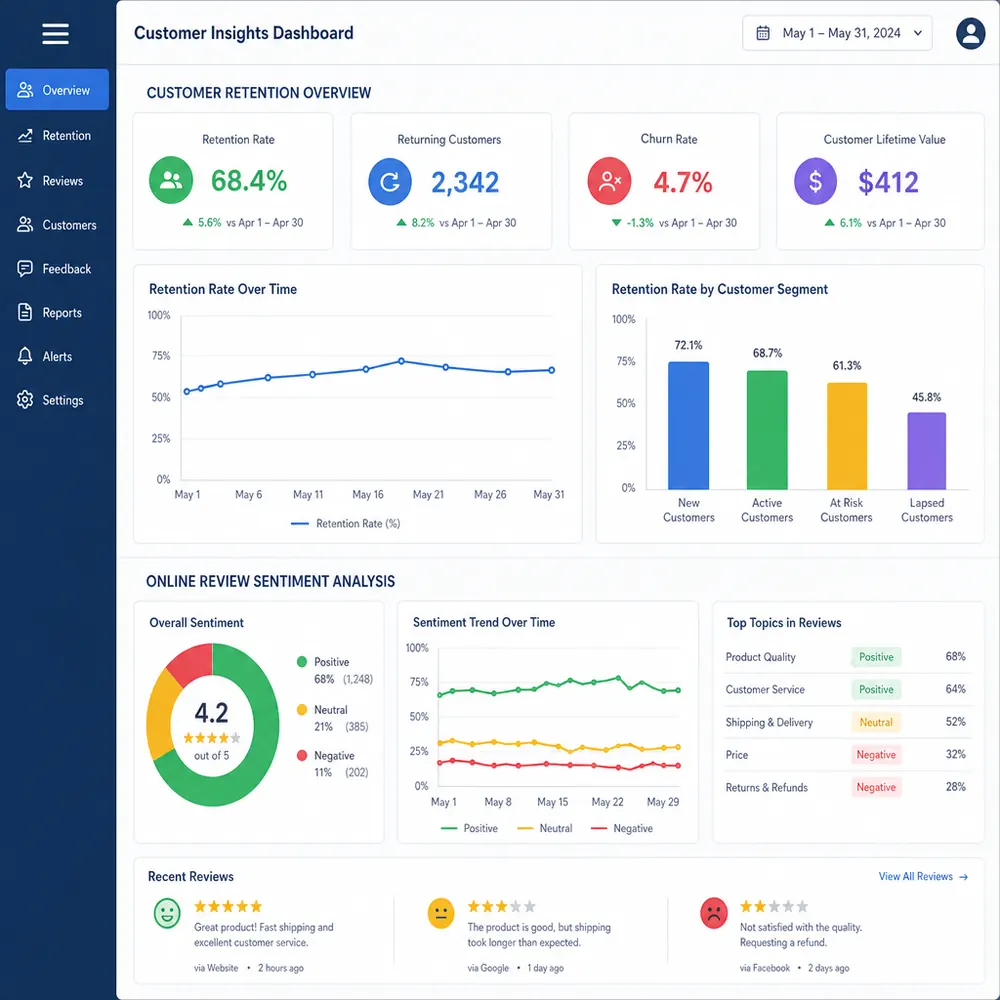
Modern BI tools aggregate all of your online reviews and social media mentions into a single dashboard. Using Natural Language Processing (NLP), the software analyzes the text to identify recurring themes and sentiments.
For example, your dashboard might alert you that the word "cold" has appeared in 15% of your reviews over the last two weeks, specifically associated with your soup. This data allows you to bypass the noise and immediately address a specific operational failure in the kitchen.
Maximizing Customer Lifetime Value for Diners
Not all guests are created equal. Understanding the customer lifetime value for diners (CLV) is crucial for targeted marketing.
CLV calculates the total revenue a specific customer is expected to generate over the course of their relationship with your restaurant. By integrating your POS with your loyalty program, you can identify your high-CLV guests and trigger personalized campaigns when they haven't visited in 60 days.
Identifying Peak Hour Dining Patterns
Knowing exactly when your guests want to eat dictates how you prep, staff, and market. Identifying peak hour dining patterns allows you to optimize your operational flow.
If data reveals that your lunch rush has slowly shifted from 12:00 PM to 1:00 PM over the last quarter, you can adjust your kitchen prep schedules. If you identify consistent "dead zones" (e.g., Tuesdays between 3:00 PM and 5:00 PM), you can implement targeted promotions to drive traffic during historically slow hours.
Operations at Scale: Multi-Unit and Supply Chain
For restaurant groups and franchises, the complexities of operations multiply with every new location.
Benchmarking Multi-Unit Restaurant Performance
When managing several locations, regional directors need to know which stores are excelling and which are lagging. Benchmarking multi-unit restaurant performance is virtually impossible without unified data.
A centralized BI platform allows executives to view enterprise-level data while simultaneously drilling down into individual store performance. Why is Location A's food cost 3% higher than Location B's, even though they use the same suppliers and menu?
By benchmarking KPIs across all units, leadership can identify "best in class" stores and use their operational metrics as the standard operating procedure for the rest of the company.
Supply Chain Visibility for Food Service
For enterprise-level operations, supply chain visibility for food service is paramount. A missing delivery or a sudden spike in commodity prices can devastate profit margins across dozens of locations.
Advanced restaurant business intelligence analytics tools can integrate with vendor systems to provide real-time tracking of ingredients from the farm to the walk-in cooler. If the price of chicken wings is forecasted to spike, your BI platform can alert you weeks in advance, allowing your culinary team to pivot and protect margins.
Choosing the Right Tools: Navigating the Market
With the clear benefits of data integration established, the final hurdle for operators is selecting the right technology.
What Makes the Best Restaurant Business Intelligence Software?
Not all software is created equal. When evaluating platforms, you need a solution tailored specifically to the unique nuances of hospitality. Generic BI tools require immense customization to make sense of restaurant metrics. Instead, look for purpose-built restaurant business intelligence software.
Key features to demand include:
- Pre-built Industry Integrations: Native API connections to all major POS systems, accounting software, and labor tools.
- Mobile Accessibility: A robust mobile app that delivers real-time alerts to your phone.
- Customizable Dashboards: Role-based dashboard customization for GMs, chefs, and marketing directors.
- Predictive Analytics: AI-driven forecasting for the future, not just historical reporting.
Working with Software Vendors
When you engage with the best restaurant business intelligence software sales teams, they should act as consultants, asking about your specific pain points and demonstrating how their platform solves those precise problems. Ask for case studies and proof of ROI.

Creating a Data-Driven Culture
Purchasing the best restaurant business intelligence software is only half the battle. The true magic happens when you cultivate a data-driven culture within your organization.
If your kitchen manager doesn't understand why they need to accurately log waste, or if your front-of-house manager doesn't trust the labor forecasting tool, your investment will sit unused.
Train your team not just on how to use the software, but on why the metrics matter. Show your head chef how lowering food waste by 2% translates to a larger quarterly bonus. When your team sees that data makes their lives easier and the business more successful, they will embrace the technology.
Conclusion: The Future Is Data
The romance of the restaurant industry, the sizzle of the grill, the clinking of wine glasses, the hum of a busy dining room, will always be its beating heart. But to protect that heart, you need a highly analytical brain.
Implementing restaurant business intelligence is no longer just for massive global chains with endless IT budgets. With the democratization of cloud-based technology, single-unit operators and growing restaurant groups now have access to the exact same enterprise-level hospitality analytics.
By moving away from manual guesswork and embracing a connected data stack, you empower yourself to track real-time sales, optimize your labor force, engineer a highly profitable menu, and deliver exceptional, personalized guest experiences.
Operational BI tells you how your restaurant performs today. Location intelligence tells you where to grow tomorrow. Run a free site selection analysis at Restaurant Site Finder to complement your data stack with market-level insights.
For deeper operational analytics guidance, read our guide on maximizing efficiency with restaurant analytics software.
Frequently Asked Questions
What is restaurant business intelligence?
It refers to technologies and practices for collecting, integrating, analyzing, and presenting data from POS, inventory, labor, and CRM systems into actionable insights.
What are the best restaurant KPIs to track?
Prime cost, RevPASH, table turn rate, customer acquisition cost, retention rate, food cost percentage, and labor cost percentage.
How does menu engineering improve profitability?
It categorizes menu items as Stars, Plowhorses, Puzzles, or Dogs, helping you promote winners, fix underperformers, and cut dead weight.
How can data reduce food waste?
Inventory analytics compares theoretical usage from POS sales to actual stock, revealing over-portioning, spoilage, and theft.
Is Restaurant Site Finder free for location data?
Yes. Enter any address for competitor mapping and opportunity scoring at restaurantsitefinder.com.
Run a free location analysis
Enter any address to get competitor mapping, market gaps, opportunity scoring, and concept ideas.
Analyze your location free Shop equipment at Horeca Store