Operations
Maximizing Efficiency with Restaurant Analytics Software
How restaurant analytics software improves efficiency, visibility across sales, labor, inventory, and guest behavior; core metrics, daily decisions, integration, tool selection, and building a data-friendly culture.
Key Takeaways
- Restaurant analytics software turns fragmented POS, labor, inventory, and guest data into patterns managers can act on before service, not after month-end.
- Track metrics that drive decisions: sales by daypart, menu contribution, labor efficiency, inventory variance, and operational speed.
- Efficiency improves when teams review exceptions, assign metric ownership, and connect systems, not when dashboards pile up unused numbers.
- Pair operational analytics with site-level demand analysis at Restaurant Site Finder when evaluating new locations or delivery zones.
Running a restaurant well takes more than great food, friendly service, and a busy dining room. Operators need a clear view of what is happening across sales, staffing, inventory, guest behavior, and day-to-day operations. Restaurant analytics software helps turn that activity into practical insight, so owners and managers can make faster, more confident decisions.
Instead of relying on instinct alone, analytics gives your team a way to see patterns, spot problems early, and focus attention where it matters most. Used well, it becomes a bridge between everyday restaurant management tools and the bigger question every operator asks: how can we run smarter without losing the hospitality that makes guests come back?
What does restaurant analytics software actually do?
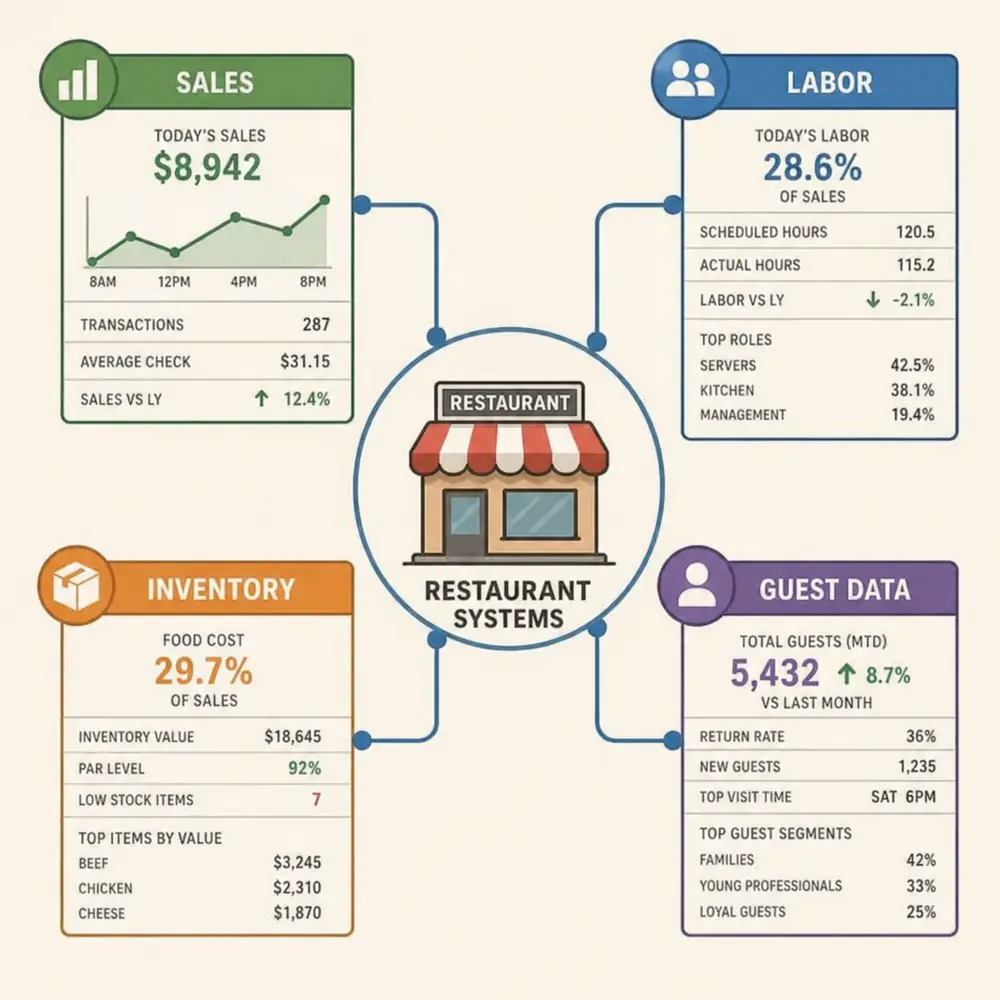
Restaurant analytics software collects and organizes operational data so restaurants can understand performance, identify trends, and improve decisions. It can bring together information from point-of-sale systems, scheduling platforms, inventory tools, online ordering channels, reservations, loyalty programs, and other systems already used in the business.
At its simplest, analytics answers questions that are easy to ask but difficult to solve manually. Which menu items are profitable, not just popular? Are labor costs aligned with sales by shift? Which days create the most waste? Are guests ordering differently online than they do in the dining room? When this information is visible in one place, managers can spend less time digging through reports and more time acting on what they learn.
The goal is not to replace experience. A seasoned manager's judgment still matters. Analytics simply adds evidence to that judgment, making it easier to separate a one-off issue from a pattern that deserves attention.
Efficiency starts with better visibility
Many restaurants have plenty of data, but it often lives in separate systems. Sales are in one platform, inventory is in another, labor schedules are somewhere else, and guest feedback may be scattered across review sites, surveys, and direct comments. When information is fragmented, even simple decisions take longer than they should.
Analytics creates efficiency by reducing that friction. A manager can review yesterday's revenue, compare it to labor spend, check item-level sales, and notice unusual trends before the next service begins. That visibility helps teams move from reactive problem-solving to proactive management.
For example, if Friday lunch sales have increased for several weeks but staffing has stayed the same, analytics can flag the mismatch. If a certain ingredient is regularly over-ordered, inventory data can help adjust purchasing before waste becomes routine. If a new menu item sells well but slows ticket times, the kitchen may need a prep adjustment rather than a promotional push.
Better visibility also supports better communication. When managers, chefs, owners, and shift leads are looking at the same information, conversations become more specific. Instead of saying, "Labor feels high," a team can discuss exactly which shifts, roles, or sales periods need adjustment.
The metrics that matter most to restaurant performance
Restaurant performance metrics are most useful when they connect directly to decisions. A dashboard full of numbers may look impressive, but it only helps if the team understands what each metric means and how to respond.
A practical analytics setup often focuses on several core areas:
- Sales trends: Revenue by daypart, channel, location, server, menu category, or promotion can show where demand is growing or softening.
- Menu performance: Item sales, contribution margins, modifiers, and preparation patterns help operators understand which dishes deserve attention.
- Labor efficiency: Labor cost as a percentage of sales, hours worked by role, overtime, and sales per labor hour can reveal scheduling opportunities.
- Inventory usage: Ingredient consumption, variance, spoilage, and purchasing patterns help reduce waste and protect margins.
- Guest behavior: Visit frequency, average check size, ordering preferences, feedback, and loyalty activity can support better service and marketing.
- Operational speed: Ticket times, order accuracy, table turns, and fulfillment times can show where the guest experience is being slowed down.
The best metrics are not always the most complex. A small restaurant may gain more from tracking daily labor alignment and menu contribution than from building an elaborate reporting system. A multi-location group may need deeper comparisons between stores, channels, and managers. The point is to choose measurements that help your team take action. Track prime cost weekly as a starting anchor.
How can analytics improve daily restaurant decisions?
Analytics improves daily restaurant decisions by turning routine information into timely guidance. It helps managers prepare for service, adjust staffing, manage inventory, evaluate menu choices, and respond to guest demand with less guesswork.
One of the clearest examples is scheduling. Restaurants often build schedules based on past habits, manager memory, and expected reservations. Those inputs matter, but analytics can add more precision by showing sales trends by hour, day, weather pattern, event period, or ordering channel when that information is available. A manager may discover that a dining room shift looks quiet overall, but takeout spikes during the same window. That insight changes how the team should be staffed.
Inventory is another daily use case. Without good data, restaurants can over-order to avoid running out, which may increase spoilage. Or they may order too tightly, which creates shortages and last-minute substitutions. Analytics can help compare actual ingredient usage with sales activity, making purchasing more disciplined over time.
Menu decisions benefit as well. A dish that sells often may still be underperforming if its ingredients are expensive, prep is complicated, or it slows the kitchen. On the other hand, a quieter menu item may deserve better placement if it has strong margins and consistent guest satisfaction. Analytics helps reveal the difference between popularity and profitability.
Daily decision-making also improves because trends become visible sooner. If average check size slips, if late-night delivery demand changes, or if a promotional item fails to gain traction, managers can react quickly rather than waiting until the end of the month.
Turning data into action without overwhelming the team
The biggest challenge with analytics is rarely access to data. It is knowing what to do with it. If reports are too complicated or disconnected from restaurant routines, teams may ignore them. To make analytics useful, operators should build simple habits around reviewing and acting on information.
A good starting rhythm might look like this:
- Review yesterday's performance before service. Look at sales, labor, standout menu items, voids, comps, and any unusual patterns.
- Check exceptions, not every number. Focus on what changed, what missed expectations, or what requires a decision today.
- Share one or two priorities with the team. For example, highlight a high-margin special, a service bottleneck, or a reservation rush.
- Document the action taken. If staffing, prep, ordering, or menu placement changes, note why.
- Review whether the change worked. Analytics becomes more valuable when decisions are followed by feedback.
This process keeps data connected to behavior. A dashboard alone does not improve efficiency. Efficiency improves when the team uses information to change what happens on the floor, in the kitchen, and in the office.
It also helps to assign clear ownership. The general manager may focus on labor and service metrics. The chef may review food cost, waste, and prep patterns. The owner or operator may look across broader trends and financial performance. When each person knows which numbers they are responsible for, analytics becomes part of management rather than an extra task.
Analytics works best when systems connect
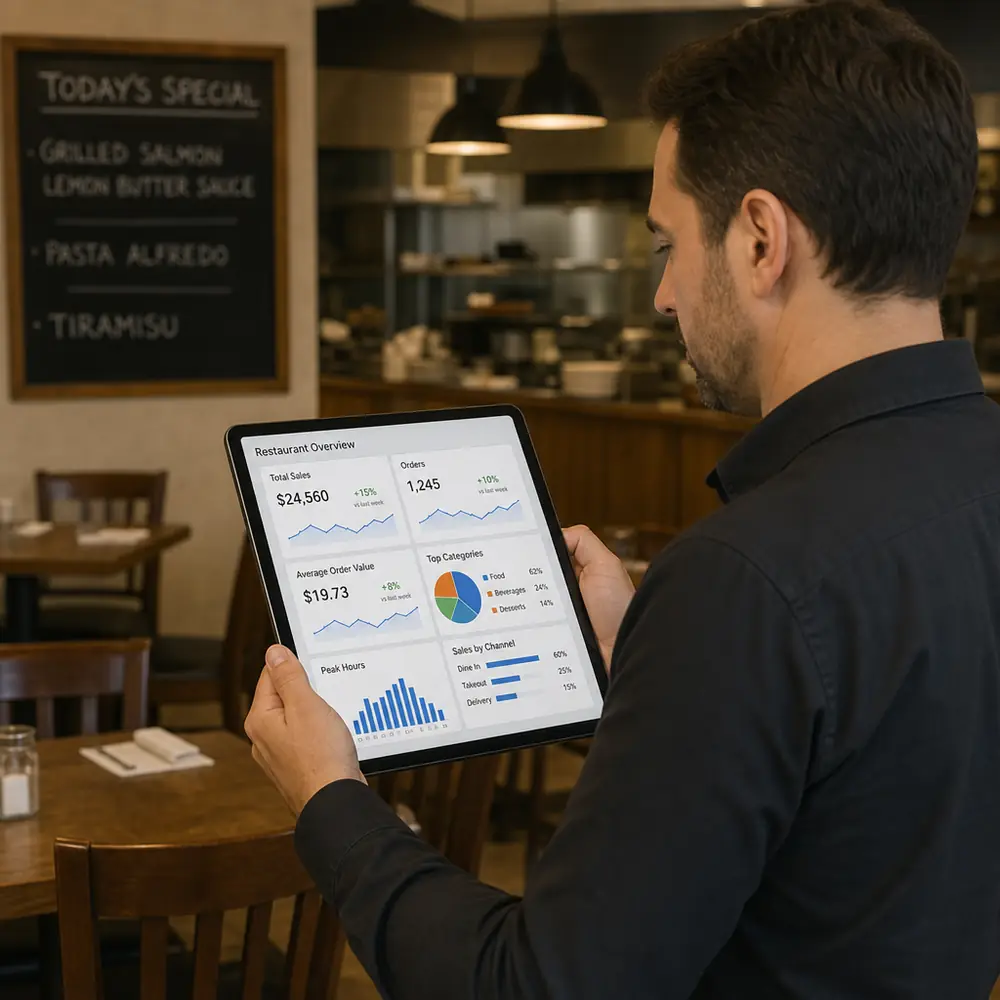
Restaurant analytics becomes more powerful when it works alongside the systems restaurants already rely on. Point-of-sale data can show what was sold, but it becomes more useful when connected to inventory, labor, reservations, and guest information. Together, those systems tell a fuller story.
For example, a sales report might show that brunch revenue is strong. When paired with labor data, it may show that profit is being squeezed by overstaffing early in the shift. When paired with inventory data, it may reveal that certain ingredients are creating avoidable waste. When paired with guest feedback, it may show that speed of service is affecting repeat visits.
This is where restaurant management tools can either simplify or complicate operations. If tools do not communicate well, managers may spend hours exporting files or manually comparing reports. If they integrate cleanly, the business can build a more complete picture with less administrative work.
Integration does not have to happen all at once. Many restaurants start with the most important connection, such as POS and labor, then add inventory or guest data as processes mature. The key is to avoid collecting information simply because it is available. Each connection should support a practical decision.
Common efficiency gains restaurants can look for
Every restaurant is different, but analytics often reveals opportunities in a few familiar areas. These are not magic fixes. They are practical improvements that come from seeing operations more clearly and making consistent adjustments.
Smarter labor planning
Labor is one of the most sensitive parts of restaurant operations. Too few people on shift can damage service and morale. Too many can put pressure on margins. Analytics helps managers compare staffing levels with actual demand, making it easier to schedule based on patterns rather than assumptions.
This can include reviewing sales per labor hour, matching roles to busy periods, and identifying shifts where overtime appears repeatedly. Over time, managers can build schedules that are more realistic for both the business and the team.
Better purchasing and waste control
Food waste can hide in small daily decisions: over-prepping, inaccurate forecasts, inconsistent portions, or slow-moving menu items. Analytics helps identify where waste is happening and whether it is tied to purchasing, production, storage, or menu design.
A restaurant might notice that a garnish is ordered frequently but used inconsistently. Another may find that a lunch item creates leftover ingredients that do not carry well into dinner service. These details are easy to miss without a structured view of inventory and sales together.
More informed menu management
Menu performance is about more than what guests order most often. A balanced menu should consider popularity, profitability, prep complexity, ingredient overlap, and the guest experience. Analytics can help identify items to promote, revise, reposition, or remove.
Managers can also use data to test changes carefully. Instead of redesigning an entire menu at once, a restaurant might adjust descriptions, feature a dish during certain shifts, or compare performance across ordering channels. Small tests reduce risk and produce clearer learning.
Improved guest experience
Efficiency should not feel cold or mechanical to guests. In fact, the right data can support warmer, more attentive hospitality. If analytics shows slow ticket times during a certain daypart, managers can adjust prep or staffing before guests feel the delay. If loyalty data shows repeat guests favor certain items or ordering channels, the restaurant can communicate more relevant offers.
Guest feedback can also become more actionable when paired with operational data. A complaint about slow service is useful, but it becomes more meaningful when connected to staffing levels, ticket times, or a sudden increase in order volume.
Choosing analytics tools with practical criteria
Selecting software should begin with the restaurant's actual decisions, not a long list of features. The best platform is the one your team can understand, trust, and use regularly.
Before choosing or expanding a system, consider these practical criteria:
- Ease of use: Managers should be able to find key information quickly, especially before or during service.
- Relevant reporting: The tool should support the restaurant performance metrics that matter to your operation, not just generic dashboards.
- Integration options: Look for compatibility with the systems already central to your workflow.
- Clear visualizations: Charts and summaries should make patterns easier to see, not harder to interpret.
- Actionable alerts: Notifications should highlight meaningful exceptions instead of creating noise.
- Scalability: A single-location restaurant and a growing group may need different levels of reporting depth.
- Team adoption: If the tool is difficult to train or easy to ignore, its value will be limited.
It is also wise to think about process before implementation. Who will review reports? How often? Which decisions will analytics influence first? What will success look like in daily behavior? Clear answers make adoption smoother. See choosing the best analytics software for restaurants for a buyer's framework.
Avoiding common analytics mistakes
Analytics can create clarity, but only if it is used thoughtfully. A common mistake is tracking too much at once. When every number seems important, teams can lose sight of the few metrics that actually drive decisions.
Another mistake is treating data as automatically objective. Restaurant data can be messy. Voids may be entered inconsistently, recipes may not be updated, inventory counts may be rushed, and labor codes may be used differently by different managers. If the inputs are unreliable, the conclusions will be limited. Good analytics depends on good operating discipline.
Restaurants should also avoid using metrics in a way that discourages hospitality. If servers are judged only by speed, they may rush the guest experience. If kitchen teams are judged only by waste reduction, they may become too conservative with prep. Metrics should support balanced decisions, not narrow behavior.
A useful approach is to pair numbers with context. If labor cost rises, ask why. Was there training? Bad weather? A local event? A large party that required extra preparation? Analytics should start better conversations, not end them too quickly.
Building a data-friendly restaurant culture
The restaurants that benefit most from analytics usually make it part of the culture. That does not mean every employee needs to study dashboards. It means the team understands that decisions are guided by both hospitality and evidence.
Managers can support this culture by explaining the "why" behind changes. If prep levels are adjusted, connect the decision to waste and freshness. If staffing changes, explain the pattern behind the schedule. If a menu item is being featured, share the reason with servers so they can speak about it confidently.
It also helps to celebrate practical wins. When a team reduces waste, improves ticket flow, or handles a rush more smoothly because of better planning, call attention to the improvement. Analytics should feel like a tool that helps the team succeed, not a surveillance system.
Training matters as well. New managers should learn not only where reports are located, but how to interpret them. A number without context can mislead. A number paired with operational understanding can improve the next shift.
A practical way to get started
Restaurants do not need to transform everything at once. A focused start is often more effective than a broad rollout. Choose one operational area where better visibility would make an immediate difference, then build from there.
A simple first-month plan could include:
- Choose three to five core metrics. Start with measurements tied to sales, labor, menu performance, or inventory.
- Set a review schedule. Decide whether managers will review reports daily, weekly, or by shift.
- Connect each metric to an action. For every number tracked, define what the team might do differently.
- Clean up data habits. Standardize how discounts, voids, waste, recipes, and labor roles are recorded.
- Review results and refine. Keep what supports decisions and remove what creates distraction.
This approach makes analytics manageable. It also helps teams build confidence. Once managers see that data can simplify decisions rather than complicate them, adoption becomes easier.
The takeaway for modern restaurant operators
Restaurant analytics software is most valuable when it helps people run better restaurants, not when it simply produces more reports. By connecting sales, labor, inventory, menu, and guest information, it gives operators a clearer view of what is working and what needs attention.
The real advantage comes from consistent use. When managers review the right metrics, ask better questions, and act on what they learn, small improvements begin to compound. Service becomes smoother, purchasing becomes sharper, schedules become more accurate, and teams gain a shared understanding of performance.
For restaurants looking to improve efficiency, the best next step is practical: identify the decisions that feel hardest to make today, then look for the data that would make those decisions clearer tomorrow. Pair operational analytics with how restaurant analytics software boosts profits and validate delivery or expansion markets free at Restaurant Site Finder.
Run a free location analysis
Enter any address to get competitor mapping, market gaps, opportunity scoring, and concept ideas.
Analyze your location free Shop equipment at Horeca Store