Operations
Maximizing Profitability with Restaurant BI Software
How restaurant BI software turns POS, labor, inventory, and guest data into profit, covering food cost control, labor planning, menu engineering, loyalty analytics, and what to look for in a platform.
Key Takeaways
- Restaurant BI software unifies POS, labor, inventory, and guest data so teams move from “What happened?” to “What should we do next?”
- Protect revenue quality, not just volume, by tracking contribution margin, channel fees, and promotion behavior.
- Use BI for food cost, labor, and menu engineering before month-end surprises.
- Pair operational BI with site-level demand analysis at Restaurant Site Finder when evaluating new locations.
Profit in a restaurant is shaped by dozens of daily decisions: what to prep, who to schedule, which menu items to promote, when to reorder, and how quickly to react when performance slips. Restaurant business intelligence software helps turn all that operational data into clear, usable insight so owners, operators, and managers can make better decisions faster. Instead of relying only on instinct or scattered spreadsheets, the right tools reveal where money is being earned, where it is leaking, and what actions can improve margins.
What does restaurant BI software actually do?
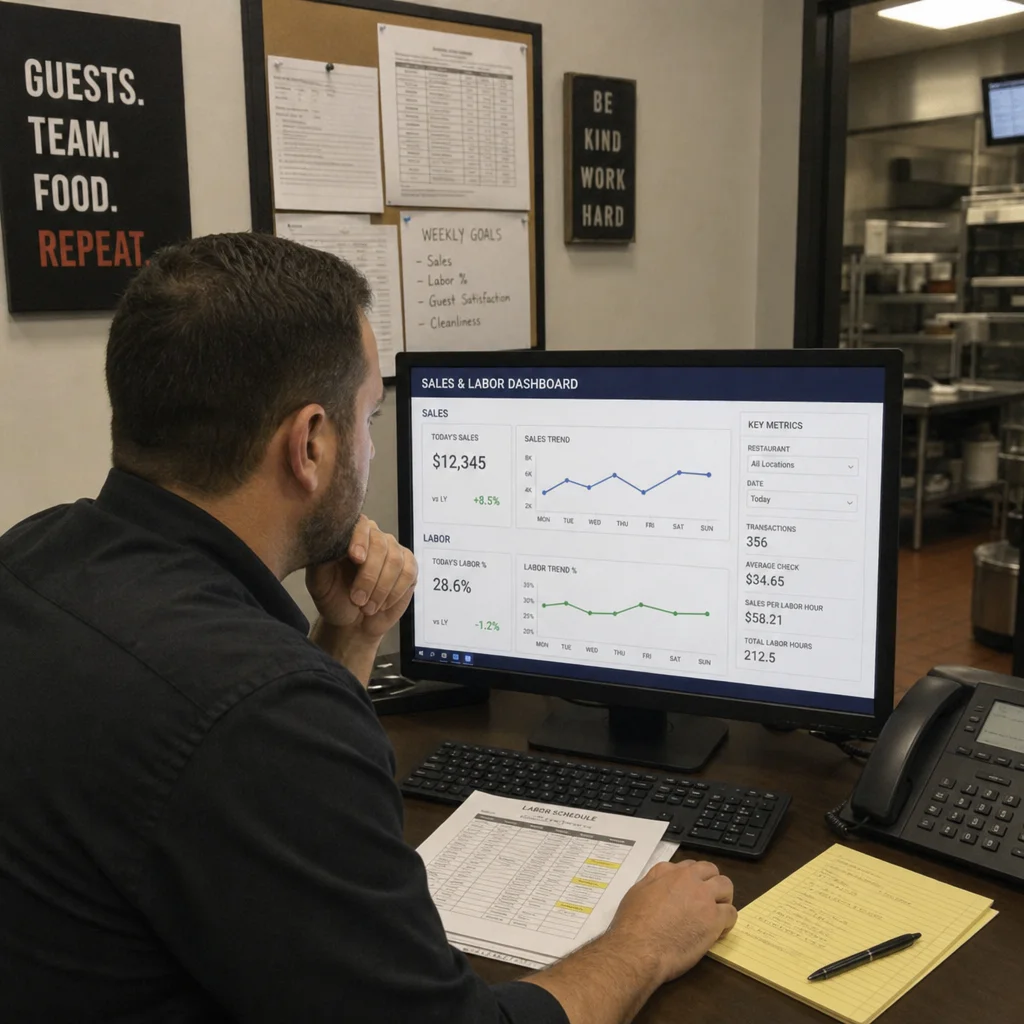
Restaurant BI software collects data from systems such as POS, inventory, labor, accounting, loyalty, delivery, and restaurant management software, then organizes it into reports, dashboards, and alerts. In practical terms, it helps operators see what is happening across sales, costs, staffing, menu performance, and guest behavior without manually stitching everything together.
That visibility matters because restaurant profitability is rarely improved by one dramatic change. More often, it comes from many smaller improvements made consistently: reducing waste, tightening labor planning, identifying high-margin menu items, catching sales dips early, and understanding which channels drive the best returns. Restaurant business intelligence & analytics software gives teams a shared source of truth, so conversations move from “What happened?” to “What should we do next?”
For a broader look at BI architecture and KPIs, see our guide to enhancing restaurant operations with business intelligence.
Profitability starts with cleaner operational visibility
Many restaurants already have plenty of data. The problem is that the data often lives in too many places. Sales are in the POS, invoices are in accounting, schedules are in a labor tool, guest notes are in a CRM or loyalty platform, and delivery performance may sit in third-party portals. When these systems do not speak clearly to each other, operators spend too much time hunting for answers.
Business intelligence solutions help solve that by bringing the most important performance indicators into one view. A general manager can check yesterday's sales, food cost, labor cost, average ticket, voids, discounts, and traffic patterns before the lunch rush. A multi-location operator can compare stores without waiting for separate reports from each manager. An owner can spot trends at a higher level while still drilling into details when something looks off.
This cleaner visibility supports stronger decisions because the team is no longer managing by memory or isolated anecdotes. If weekday lunch traffic is falling, the data can show whether the issue is fewer guests, lower average check, reduced delivery volume, menu mix changes, or operational inconsistency. Each cause requires a different response, and BI makes the difference clearer.
Turning sales data into smarter revenue decisions
Sales reports are useful, but sales intelligence is more powerful. A basic report might tell you that revenue was higher this Friday than last Friday. A stronger BI view can show which daypart improved, which menu items drove the increase, whether discounts affected margin, and whether the growth came from dine-in, takeout, delivery, catering, or online ordering.
That deeper view helps restaurants protect revenue quality, not just revenue volume. A promotion that increases ticket count but lowers margin may not be as successful as it first appears. A menu item with strong sales but high food cost may need portion review, supplier evaluation, price adjustment, or repositioning. A slower daypart may benefit from a targeted offer, but only if the offer attracts profitable demand rather than training guests to wait for discounts.
Useful revenue questions to explore in restaurant business intelligence software include:
- Which items generate the strongest contribution margin, not just the most sales?
- Which dayparts have enough traffic to support current staffing levels?
- Which promotions create repeat visits versus one-time discount behavior?
- Which ordering channels produce profitable volume after fees and packaging costs?
- Which locations, servers, or service periods consistently outperform the average?
When teams review these questions regularly, they can make practical adjustments with more confidence. That could mean featuring profitable items more prominently, refining limited-time offers, updating menu placement, coaching staff on suggestive selling, or shifting marketing spend toward channels that actually support margin.
How can BI improve food cost control?
BI improves food cost control by connecting purchasing, inventory, recipe, waste, and sales data so operators can see where cost variance is coming from. Instead of discovering a margin problem at the end of the month, managers can identify issues earlier and respond while there is still time to correct them.
Food cost is especially difficult because it changes constantly. Supplier prices fluctuate, portioning can drift, prep forecasts may miss the mark, and waste can rise during slower periods. A restaurant may know its target food cost, but without good visibility, it can be hard to see why actual cost is moving away from that target.
Restaurant business intelligence & analytics software can help highlight patterns such as:
- Recipe margin pressure: Items that were profitable when created may become less attractive as ingredient costs change.
- Waste and spoilage trends: Repeated waste on specific ingredients may point to over-prepping, poor forecasting, storage issues, or menu imbalance.
- Purchasing variance: Price changes by vendor, ingredient, or category can be easier to catch when invoices are reviewed through a dashboard.
- Inventory inconsistencies: Variance between theoretical and actual usage may suggest portioning problems, training gaps, theft, or counting errors.
- Menu mix shifts: If guests move toward lower-margin items, overall profitability can decline even when sales look stable.
The goal is not to turn every manager into a data analyst. The goal is to make the right signals visible enough that the team can take action. If chicken usage is unusually high compared with sales, managers can inspect portioning, prep sheets, waste logs, and recipe adherence. If dairy costs spike, they can review supplier changes, menu items affected, and whether pricing needs attention. Track progress against prime cost targets weekly, not monthly.
Labor planning becomes more precise
Labor is one of the largest controllable costs in restaurant operations, and it is also one of the most sensitive. Understaffing can damage service, slow table turns, increase mistakes, and burn out employees. Overstaffing protects service but can quickly erode profit during soft sales periods. Better labor planning depends on matching staffing to expected demand with enough flexibility for real-world conditions.
BI supports this by combining historical sales, guest counts, daypart trends, weather considerations where available, events, holidays, and labor performance. Managers can compare scheduled labor against actual demand and see where plans consistently miss. Over time, this creates a more disciplined approach to scheduling.
A practical labor dashboard might help teams review:
- Sales per labor hour by location, daypart, or role
- Overtime trends and recurring schedule pressure points
- Labor cost as a percentage of sales
- Forecasted versus actual guest counts
- Productivity differences between similar shifts
- The impact of training, callouts, or turnover on performance
This kind of insight should support people, not punish them. A strong operator uses labor data to create more realistic schedules, reduce last-minute chaos, and protect service standards. When teams understand the “why” behind staffing decisions, BI becomes a planning tool rather than just a cost-cutting instrument.
Menu engineering gets easier with better analytics
Menu engineering is often described as a creative exercise, but it depends heavily on good data. Operators need to know which items are popular, which are profitable, which are operationally complex, and which ones create bottlenecks in the kitchen. Restaurant business intelligence software makes those patterns easier to see.
A high-performing menu is not always the largest menu. In many cases, profitability improves when restaurants reduce complexity, highlight stronger items, and remove dishes that create prep burden without enough financial return. BI can help identify the items worth protecting, improving, promoting, or retiring.
Consider these menu review actions:
- Group items by popularity and profitability. Popular, high-margin items deserve strong placement and staff attention. Low-margin but popular items may need pricing, portion, or ingredient review.
- Look beyond item sales. A dish may sell well but slow down the kitchen, require unique ingredients, or contribute to waste.
- Review modifier behavior. Add-ons, substitutions, and customizations can reveal opportunities for upsells or operational simplification.
- Track seasonal performance. Some items may only make sense during specific periods, especially if ingredient cost or demand shifts throughout the year.
- Connect menu changes to guest response. After a price adjustment or item redesign, track not only sales volume but also margin, complaints, refunds, and repeat behavior.
This approach keeps menu decisions balanced. Data should not replace culinary judgment, but it can sharpen it. The best decisions often come when chefs, managers, and operators review the same information and apply their experience to what the numbers reveal.
Guest behavior reveals opportunities for profitable loyalty
Profitability is not only about reducing cost. It is also about attracting the right demand and encouraging guests to return. When BI connects transaction history with loyalty, reservation, online ordering, and marketing data, restaurants can better understand who their guests are and what motivates them.
For example, operators may discover that certain guests visit frequently but only during discounted periods. Others may order high-margin items, bring larger parties, or respond well to seasonal offers. Some guests may shift from dine-in to delivery, changing the economics of the relationship. These details help restaurants create more thoughtful outreach.
Instead of sending broad promotions to everyone, BI can support more targeted decisions. A casual restaurant might invite lapsed regulars back with a specific offer tied to their past preferences. A full-service concept might identify guests who book for special occasions and create timely reminders. A quick-service brand might use order history to promote profitable bundles.
The practical benefit is relevance. Guests receive communication that feels more useful, while the restaurant avoids unnecessary discounting. Over time, that can support stronger repeat visits, better average checks, and healthier margins.
What should operators look for in a BI solution?
Operators should look for a BI solution that connects easily to existing systems, presents data clearly, supports role-based decision-making, and turns insight into action. The best platform is not always the one with the most features; it is the one managers will actually use during a busy operating week.
Before choosing a tool, it helps to define the decisions you want to improve. If your biggest challenge is food cost, prioritize inventory, recipe, purchasing, and waste visibility. If labor is the issue, look closely at forecasting, scheduling integrations, and productivity reporting. If you operate multiple locations, consistency, benchmarking, and permission controls become more important. Compare options with our choosing best analytics software for restaurants buyer's guide.
A useful evaluation checklist includes:
- System integrations: Can it connect with your POS, accounting tools, inventory platform, labor system, delivery channels, and restaurant management software?
- Dashboard clarity: Can a manager understand the main signals quickly without digging through complicated reports?
- Custom views: Can different roles see the metrics that matter most to them?
- Timely alerts: Can the system flag unusual cost, sales, or labor changes before they become bigger problems?
- Multi-location reporting: Can you compare stores fairly while accounting for differences in size, market, and format?
- Data accuracy controls: Are there ways to spot missing data, duplicate records, or inconsistent mapping?
- Actionable reporting: Does the system help the team decide what to do, or does it simply display numbers?
Ease of adoption is especially important. If managers need hours to build every report, usage may fade after launch. Look for workflows that fit naturally into pre-shift planning, weekly performance reviews, menu meetings, and monthly financial discussions.
Making BI part of the management rhythm
Even strong business intelligence solutions will fall short if they are treated as occasional reporting tools. The value comes from building BI into the restaurant's operating rhythm. That means deciding which metrics are reviewed daily, weekly, and monthly, and assigning clear ownership for follow-up.
A simple cadence can work well:
- Daily: Review sales, labor, voids, discounts, guest count, top items, and any unusual variances.
- Weekly: Review food cost indicators, waste, scheduling accuracy, channel performance, and menu mix.
- Monthly: Review profitability trends, pricing opportunities, vendor changes, marketing performance, and location comparisons.
- Quarterly: Revisit broader strategy, menu structure, technology gaps, and operational goals.
The cadence should be realistic. A busy manager does not need another long meeting with unclear outcomes. Short, focused reviews are usually more effective, especially when each review ends with a specific action: adjust prep levels, coach a team member, investigate a cost spike, test a menu placement, or refine next week's schedule.
It also helps to define a small set of priority metrics. Restaurants can track hundreds of numbers, but too many metrics can blur focus. Start with the indicators most closely tied to profit and operational control, then expand as the team becomes more comfortable.
Common mistakes that limit BI value
Restaurant BI succeeds when the data is trusted and the process is practical. It struggles when teams buy software without changing habits, connect too many messy data sources at once, or focus on dashboards that look impressive but do not guide decisions.
Common mistakes include:
- Tracking vanity metrics only. Total sales matter, but they do not tell the full profitability story.
- Ignoring data quality. Incorrect item mapping, inconsistent categories, and missing invoices can lead to poor conclusions.
- Overcomplicating dashboards. If the most important answer is buried, managers may stop using the tool.
- Failing to assign ownership. Every alert or report should have someone responsible for review and follow-up.
- Using data only after problems appear. BI is most valuable when it helps prevent issues, not just explain them afterward.
Avoiding these mistakes does not require perfection. It requires discipline. Start with a few high-impact use cases, make sure the data is clean enough to trust, and create a routine for turning insight into action.
Better insight leads to better restaurant decisions
Profitability improves when restaurant teams can see clearly, act quickly, and learn from the results. Restaurant business intelligence software supports that process by connecting operational data to the decisions managers make every day. From food cost and labor planning to menu engineering and guest engagement, BI helps restaurants identify what is working, what needs attention, and where the next opportunity may be.
The most successful operators do not use data as a substitute for experience. They use it to sharpen experience, reduce guesswork, and create more consistent management habits. With the right restaurant business intelligence & analytics software and a practical adoption plan, restaurants can move from reactive reporting to smarter, more profitable operations.
Before expanding or opening a new unit, validate demand and trade-area fit with a free scan at Restaurant Site Finder, location mistakes are one problem BI cannot fix after the lease is signed.
Run a free location analysis
Enter any address to get competitor mapping, market gaps, opportunity scoring, and concept ideas.
Analyze your location free Shop equipment at Horeca Store