Site Selection
Maximizing Restaurant Success Through Foot Traffic Insights
How restaurant foot traffic analysis—pedestrian volume, peak hours, weekday vs. weekend patterns, co-tenancy, and parking—reduces lease risk and lifts revenue.
Key Takeaways
- Restaurant foot traffic analysis measures volume, quality, conversion potential, and context—not just “busy street” impressions.
- Evaluate dayparts, weekday vs. weekend mix, movement/heat maps, co-tenancy, events, accessibility, and parking before you lease.
- Translate pass-by traffic into revenue with capture rate, transactions, and average ticket scenarios.
- Compare sites free at Restaurant Site Finder, then deepen with our AI foot traffic guide and Go/No-Go framework.
Choosing the right restaurant location and running day-to-day operations both depend on one core variable: whether the right customers reliably pass by your door. That’s what restaurant foot traffic analysis helps quantify. By measuring pedestrian volume, visit patterns, and movement behavior around (and inside) a location, restaurant owners can reduce lease risk, staff smarter, and convert more of the demand already in the trade area.
This article explains how to use foot traffic insights in a practical, data-driven way—covering pedestrian volume, peak hours, weekday vs. weekend patterns, customer movement, nearby businesses, event-driven traffic, accessibility, parking availability, and the direct link between foot traffic and sales. You’ll also learn how modern restaurant analytics tools—and Restaurant Site Finder—turn those signals into clearer site decisions.
What Is Restaurant Foot Traffic Analysis?
Restaurant foot traffic analysis is the process of collecting and interpreting data about how many people are present in a trade area, when they are there, how they move, and how often they return. For location decisions, it focuses on the area around a prospective site (street segment, block, shopping center, transit stop radius). For operations, it can also include in-store flow and queue behavior.
Unlike a one-time “busy street” impression, foot traffic analysis looks at patterns:
- Volume: how many people pass by and how that changes by hour/day/season
- Quality of traffic: whether those people match your target customers
- Conversion potential: how likely passersby are to become guests
- Repeat behavior: how frequently customers return
- Context: what nearby businesses, events, and accessibility factors drive demand
Why Foot Traffic Insights Matter for Restaurant Profitability
Restaurants operate on tight margins, and real estate decisions are hard to undo. Foot traffic data helps owners replace guesswork with measurable indicators, such as expected guest counts by daypart and realistic sales ranges based on conversion and average ticket.
Done well, foot traffic analysis supports:
- Smarter site selection: identify corridors and centers where demand is sustained—not just occasional
- Better staffing and prep: align labor and inventory with demand peaks
- Higher marketing efficiency: time promotions to slow periods and target audiences that already frequent the area
- Improved guest experience: reduce wait times and optimize service flow during rushes
Core Foot Traffic Metrics That Predict Restaurant Performance
To connect foot traffic to revenue, focus on metrics that translate into guests served and orders placed.
- Pedestrian volume (pass-by traffic): people who pass a storefront or center entrance
- Visit volume (arrivals): people who enter the restaurant (or a specific venue within a center)
- Capture rate: the share of pass-by traffic that becomes visits
- Daypart distribution: how traffic splits across breakfast/lunch/dinner/late-night
- Weekday vs. weekend mix: whether demand is driven by workdays, leisure, or both
- Dwell time: how long people stay in the restaurant or trade area (useful for table turns and queue planning)
- Repeat visitation: how often people return within 30/60/90 days
- Trade area origin: where visitors come from (nearby residents, commuters, tourists)
Pedestrian Volume: The Starting Point (and Its Common Trap)
High pedestrian counts can be valuable, but only if that traffic matches your concept and can be converted into paying guests. A nightlife strip might have huge volume at midnight, but a breakfast-focused café may struggle if morning traffic is weak.
What to evaluate with pedestrian volume:
- Consistency: steady daily traffic is often safer than spikes
- Visibility and “decision time”: do passersby have enough time to notice signage and enter?
- Side-of-street and directionality: the “right” side can matter near transit stops, parking exits, or office corridors
Practical example: A fast-casual lunch concept compares two sites with similar rents. Site A has higher overall pass-by volume, but most traffic peaks after 7 p.m. Site B has lower total volume but strong weekday lunch footfall from nearby offices. If the concept’s strongest unit economics rely on lunch throughput, Site B may produce more reliable revenue.
Pair volume with demographic fit—who is walking by matters as much as how many.
Peak Traffic Hours: Turning Demand Curves into Staffing and Revenue Plans
Peak traffic hours indicate when you need capacity—staff, kitchen throughput, seating, and ordering technology—to avoid bottlenecks that cost sales. The goal is to match operational capacity to demand, rather than staffing based on intuition.
Use hourly foot traffic to:
- Schedule labor: align front-of-house and kitchen coverage to peaks
- Plan prep: reduce stockouts during rushes and over-prep during lulls
- Optimize ordering flow: add mobile ordering, a second POS station, or simplified peak-time menus
Revenue link: If your peak-hour conversion is strong but lines are long, you’re likely demand-constrained. Improving throughput can increase sales without spending more on marketing.
Weekday vs. Weekend Patterns: Matching the Concept to the Market
Weekday and weekend traffic often represent different customer missions:
- Weekdays: commuters, office workers, school-related trips, routine dining
- Weekends: families, shoppers, social dining, tourists, events
Compare the ratio of weekday-to-weekend visits and the strength of each daypart. A neighborhood pizzeria might thrive on weekend family dinner peaks, while a salad-and-sandwich shop may need weekday lunch reliability.
Practical example: If a proposed site shows high Saturday traffic but low Monday–Thursday lunch traffic, a concept designed around weekday corporate catering may underperform. Conversely, a brunch concept could benefit disproportionately from weekend spikes.
Customer Movement and Heat Mapping: Where People Actually Go
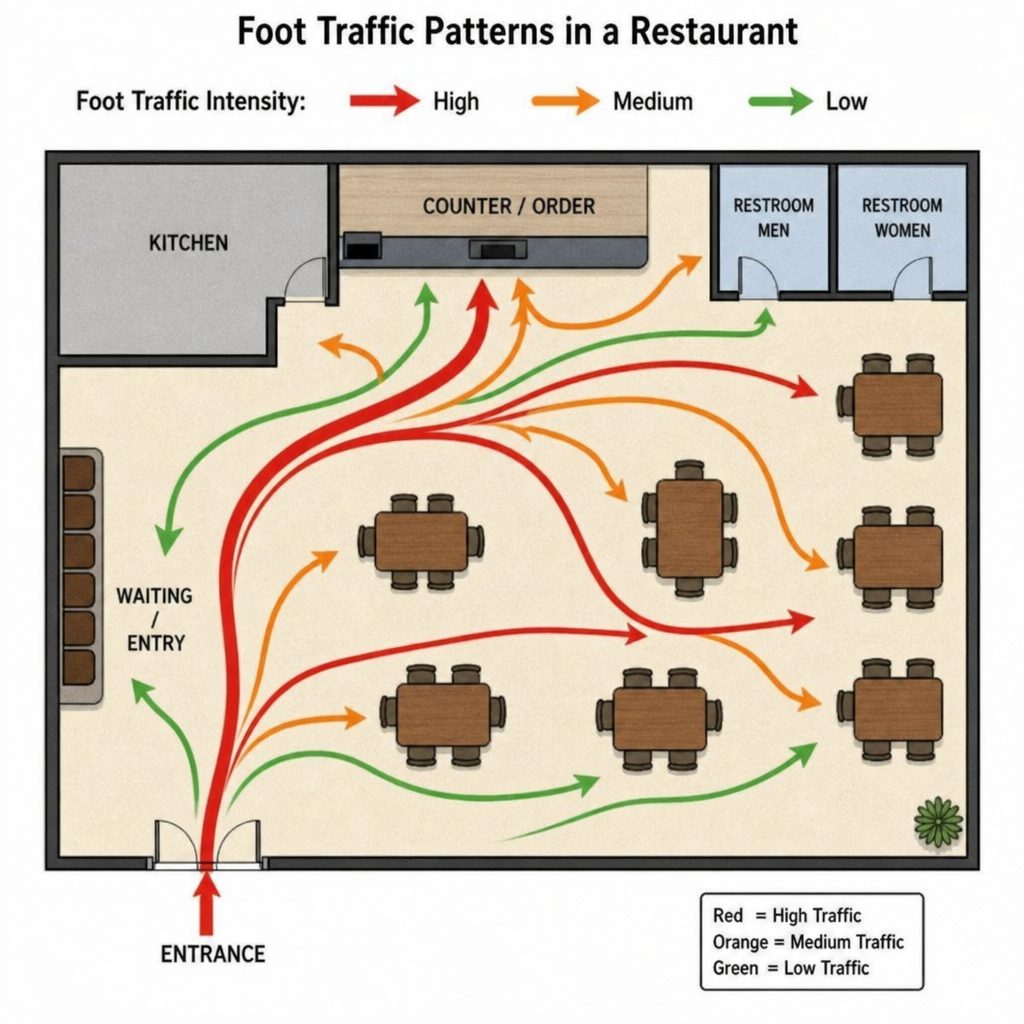
Foot traffic insights are most useful when they include movement—how people flow through an area and which entrances, corners, or corridors attract the most attention. In a shopping center, a space near the anchor tenant’s exit may outperform a quieter wing even if overall center traffic is strong.
Movement analytics can support decisions like:
- Site micro-positioning: selecting the right end-cap, corner, or inline unit
- Signage placement: positioning exterior signs where sightlines are longest
- Interior layout: reducing friction from entry to ordering and from ordering to pickup
Operational example: A quick-service restaurant uses in-store heat mapping to see that guests cluster near the pickup counter, causing congestion and longer perceived wait times. Repositioning the pickup shelf and queue stanchions improves flow and increases peak-hour throughput.
Nearby Businesses and Co-Tenancy: Demand You Didn’t Pay For
Restaurants rarely succeed in isolation. Nearby businesses can generate consistent “borrowed traffic,” especially when customer missions align.
Evaluate:
- Complementary neighbors: gyms, cinemas, grocery stores, offices, colleges, medical centers
- Competing neighbors: similar concepts that may split demand—or validate it if the area is underserved
- Trip chaining: whether people can easily combine your restaurant with other errands
Practical example: A fast-casual concept near a gym and a grocery store may benefit from post-workout and “after errands” dinner traffic. Foot traffic data can show whether those adjacent venues generate meaningful evening flow past your storefront.
Event-Driven and Seasonal Traffic: Planning for Spikes Without Over-Relying on Them
Concerts, sports games, festivals, and conventions can create large spikes in foot traffic—but the key question is whether those spikes translate into revenue for your concept.
Use event-based analysis to understand:
- Spike timing: before, during, or after an event
- Customer fit: families vs. late-night crowds vs. tourists
- Operational readiness: the staffing, menu, and inventory needed to capitalize on surges
Risk reduction tip: If a site’s strongest traffic depends on a seasonal event calendar, model a “no-event month” scenario to avoid overestimating baseline demand.
Accessibility, Visibility, and Walkability: The Hidden Multipliers
Two locations can have similar foot traffic volume but very different conversion outcomes depending on accessibility:
- Transit access: proximity to rail/bus stops and the direction of commuter flow
- Walkability and crossings: safe crosswalks, curb cuts, sidewalk width, lighting
- Visibility: clear sightlines, signage allowance, obstructions (trees, parked cars, building setbacks)
- Ingress/egress: how easy it is to enter and exit on foot and by car
Practical example: A site across a multi-lane road from a busy shopping district may “look close,” but poor crossings can sharply reduce walk-in conversion. Foot traffic counts might be high on the opposite side—yet your storefront sees far fewer actual opportunities. For trade-area geometry that accounts for barriers, see our trade area analysis guide.
Parking Availability: Converting Vehicle Traffic into Real Visits
In many U.S. markets, parking is a primary driver of restaurant choice—especially for family dining and suburban concepts. Even in dense areas, short-term parking and rideshare pickup zones influence peak-hour volume.
Assess parking in a way that connects to revenue:
- Quantity and turnover: enough spaces, plus realistic availability during your peaks
- Convenience: distance from parking to entry, lighting, and perceived safety
- Restrictions: validation rules, time limits, enforcement, event-day closures
Operational example: If Friday dinner traffic is strong in the area but your parking lot is shared with a high-turnover retail neighbor, guests may abandon visits when they can’t find a space. Tracking peaks alongside parking availability helps quantify lost demand and supports negotiation with landlords (reserved spaces, signage, validation).
How Foot Traffic Data Influences Revenue Potential (A Simple Model)
Foot traffic becomes financially useful when you translate it into realistic sales ranges. A simplified model looks like this:
- Pass-by traffic × capture rate = visits
- Visits × conversion to purchase = transactions
- Transactions × average ticket = revenue
Foot traffic analysis improves each input by grounding it in observed patterns rather than assumptions. It also helps you stress-test scenarios (bad weather weeks, off-season months, construction disruption, or a competing restaurant opening nearby).
Using Foot Traffic Insights to Reduce Location Risk: A Practical Checklist
If you’re evaluating a new site (opening, relocating, or expanding), use this checklist to reduce risk:
- Confirm the “right” volume: measure foot traffic by daypart, not just daily totals
- Validate weekday/weekend fit: ensure the market supports your concept’s strongest occasions
- Map movement: identify the highest-opportunity corners, entrances, and paths
- Evaluate co-tenancy: confirm that nearby businesses generate traffic aligned with your menu and price point
- Quantify event impact: separate baseline demand from event-driven spikes
- Audit accessibility and parking: conversion depends on convenience
- Compare competitors: measure whether competition is siphoning demand—or if the area is still under-served
Restaurant Analytics Tools: From Manual Counts to Data-Driven Location Intelligence
Historically, restaurant owners relied on manual counting, casual observation, and “vibes.” Those methods can still add context, but they are limited: they cover short windows, are hard to repeat, and can miss patterns like weekday lunch strength or seasonal shifts.
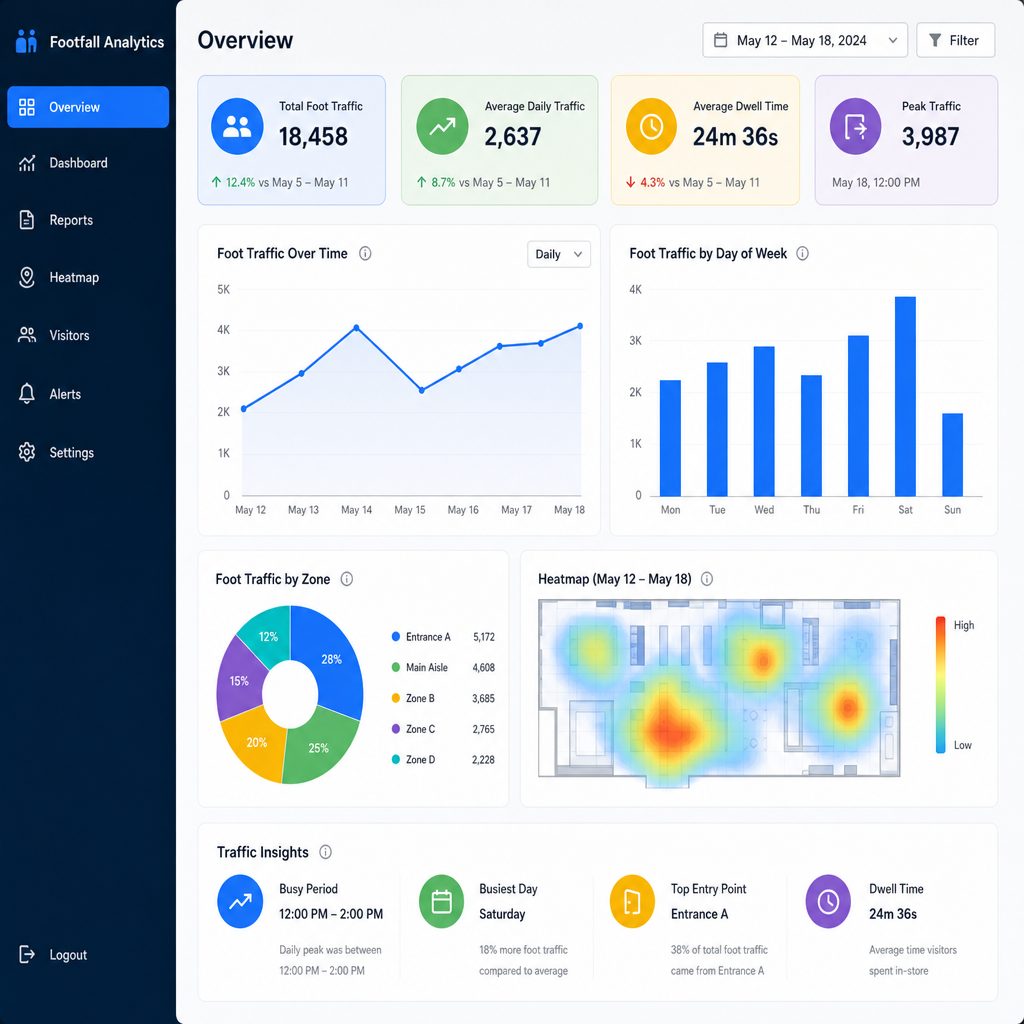
Modern restaurant analytics tools can combine multiple signals, such as aggregated mobility patterns, visit frequency, daypart trends, and trade-area behavior. When paired with sales and operational data (POS, reservations), these tools help answer not just “Is it busy?” but “Is it busy with the customers we need, at the times that matter?” For a broader tool comparison, see top tools for finding restaurant locations.
How Restaurant Site Finder Uses AI to Analyze Foot Traffic
Restaurant Site Finder is designed for restaurant owners and operators who want an objective way to evaluate potential locations. Instead of relying on one-off observations or isolated data points, Restaurant Site Finder combines AI-powered foot traffic analysis with other location signals to support better site decisions.
In practice, that means Restaurant Site Finder can bring together:
- Foot traffic analysis: patterns by hour, day, and season; movement and trade-area behavior
- Demographic insights: who lives, works, and spends time nearby (and how that matches your target guests)
- Competitor analysis: where similar restaurants are clustered, what concepts dominate, and where gaps may exist
- Market demand: signals that indicate whether the area can support your cuisine, pricing, and format
- Location intelligence: accessibility factors, nearby points of interest, and micro-location advantages
Objective comparison to generic location research methods:
- Generic approach: manual pedestrian counts, a few drive-bys, reading reviews, and browsing maps. Benefit: quick and inexpensive. Limitation: often misses daypart/seasonal patterns and can overweigh anecdotal impressions.
- Restaurant Site Finder approach: a structured, data-driven view that evaluates foot traffic in context (demographics, competition, demand, and accessibility). Benefit: helps reduce site-selection uncertainty and makes it easier to compare multiple locations using consistent criteria.
The goal isn’t to replace local knowledge—it’s to support it with evidence, so decisions are easier to defend to partners, investors, and lenders.
Practical Ways to Use Foot Traffic Insights to Maximize Customer Acquisition
Foot traffic analysis isn’t only for choosing a location. After opening, it can improve marketing ROI and help you capture more of the traffic you already have.
- Time promotions to demand gaps: If data shows a mid-afternoon lull, test a limited-time offer for that window.
- Improve storefront conversion: Use movement patterns to refine signage, window messaging, and entry visibility.
- Adapt to daypart demand: If weekday lunch drives volume, streamline lunch ordering and prep for speed.
- Partner locally: If nearby offices drive traffic, develop corporate lunch bundles or catering offers.
- Plan for events: If event-driven traffic peaks after games, optimize staffing and menu items that travel well.
Conclusion: Use Foot Traffic Analysis Before You Commit to a Lease
Restaurant foot traffic analysis helps owners make better location and operational decisions by revealing how people move, when they show up, and what context drives visits. When you evaluate pedestrian volume, peak hours, weekday vs. weekend patterns, nearby businesses, event-driven spikes, accessibility, and parking—then translate those signals into revenue scenarios—you dramatically reduce the risk of choosing the wrong site and increase your odds of sustainable growth.
If you’re planning to open, relocate, or expand, consider using Restaurant Site Finder to evaluate locations with AI-powered foot traffic analysis plus demographics, competitor analysis, market demand, and location intelligence. It’s a practical way to compare options objectively and choose a restaurant site with stronger, data-backed revenue potential—before you sign a lease.
Run a free location analysis
Enter any address to get competitor mapping, market gaps, opportunity scoring, and concept ideas.
Analyze your location free Shop equipment at Horeca Store